## 📓 Summary
Closes#150977
This documentation helps to better understand how we can define and
trigger custom events in the infra plugin using a centralized service
that is injected into the Kibana context for the easiest consumption.
It includes documentation for:
- Quick overview of the `TelemetryService`
- How to define custom events with TelemetryService
- Examples of using custom events in the plugin
It also includes some minor changes to the definition of the
TelemetryService types.
---------
Co-authored-by: Marco Antonio Ghiani <marcoantonio.ghiani@elastic.co>
Co-authored-by: kibanamachine <42973632+kibanamachine@users.noreply.github.com>
## Summary
Closes https://github.com/elastic/kibana/issues/145137
Initially this issue was just going to include moving the time context
into the query state machine. However, this actually made working with
the dependant log position code a lot harder. As such the log position
code has also been moved to it's own state machine.
## 🕵️♀️ Reviewer hints and notable changes
- There are some comments left inline (*previous logic* notes might be
useful)
- There is now a new machine for dealing with Log Position state (target
position, latest position, visible positions).
- Time based context (time range, timestamps, refresh interval) is now
moved to the query machine (this will also make dealing with saved
queries easier).
- The page state machine is the only machine that the UI interacts with
(either reading context or sending events). The page state machine
co-ordinates forwarding necessary events to other internal machines.
- Ensure relevant notifications reach their targets, e.g. when time is
changed, positions should also update.
- [There is some documentation regarding URL state and
precedence](f9ca0f795c).
- `updateContextInUrl` now always sets the full URL-relevant context in
the URL when called (since the `urlStateStorage.set()` call replaces the
whole key).
- Within the Log Stream Query state machine the `initialized` state node
is now modelled as a parallel state node, this is so `query` and `time`
can act independently (time needs to handle things like the refresh
interval, for example).
## 🕹 Testing
(Just some ideas)
- Can the time range be changed?
- Can the refresh interval be changed?
- Is state synchronised to the URL and to relevant Kibana services (time
filter service etc)?
- When streaming is enabled, are requests dispatched correctly on an
interval?
- Do positions update correctly whilst interacting with the stream?
(scrolling etc)
- Does the backwards compatibility of initialising from the URL work?
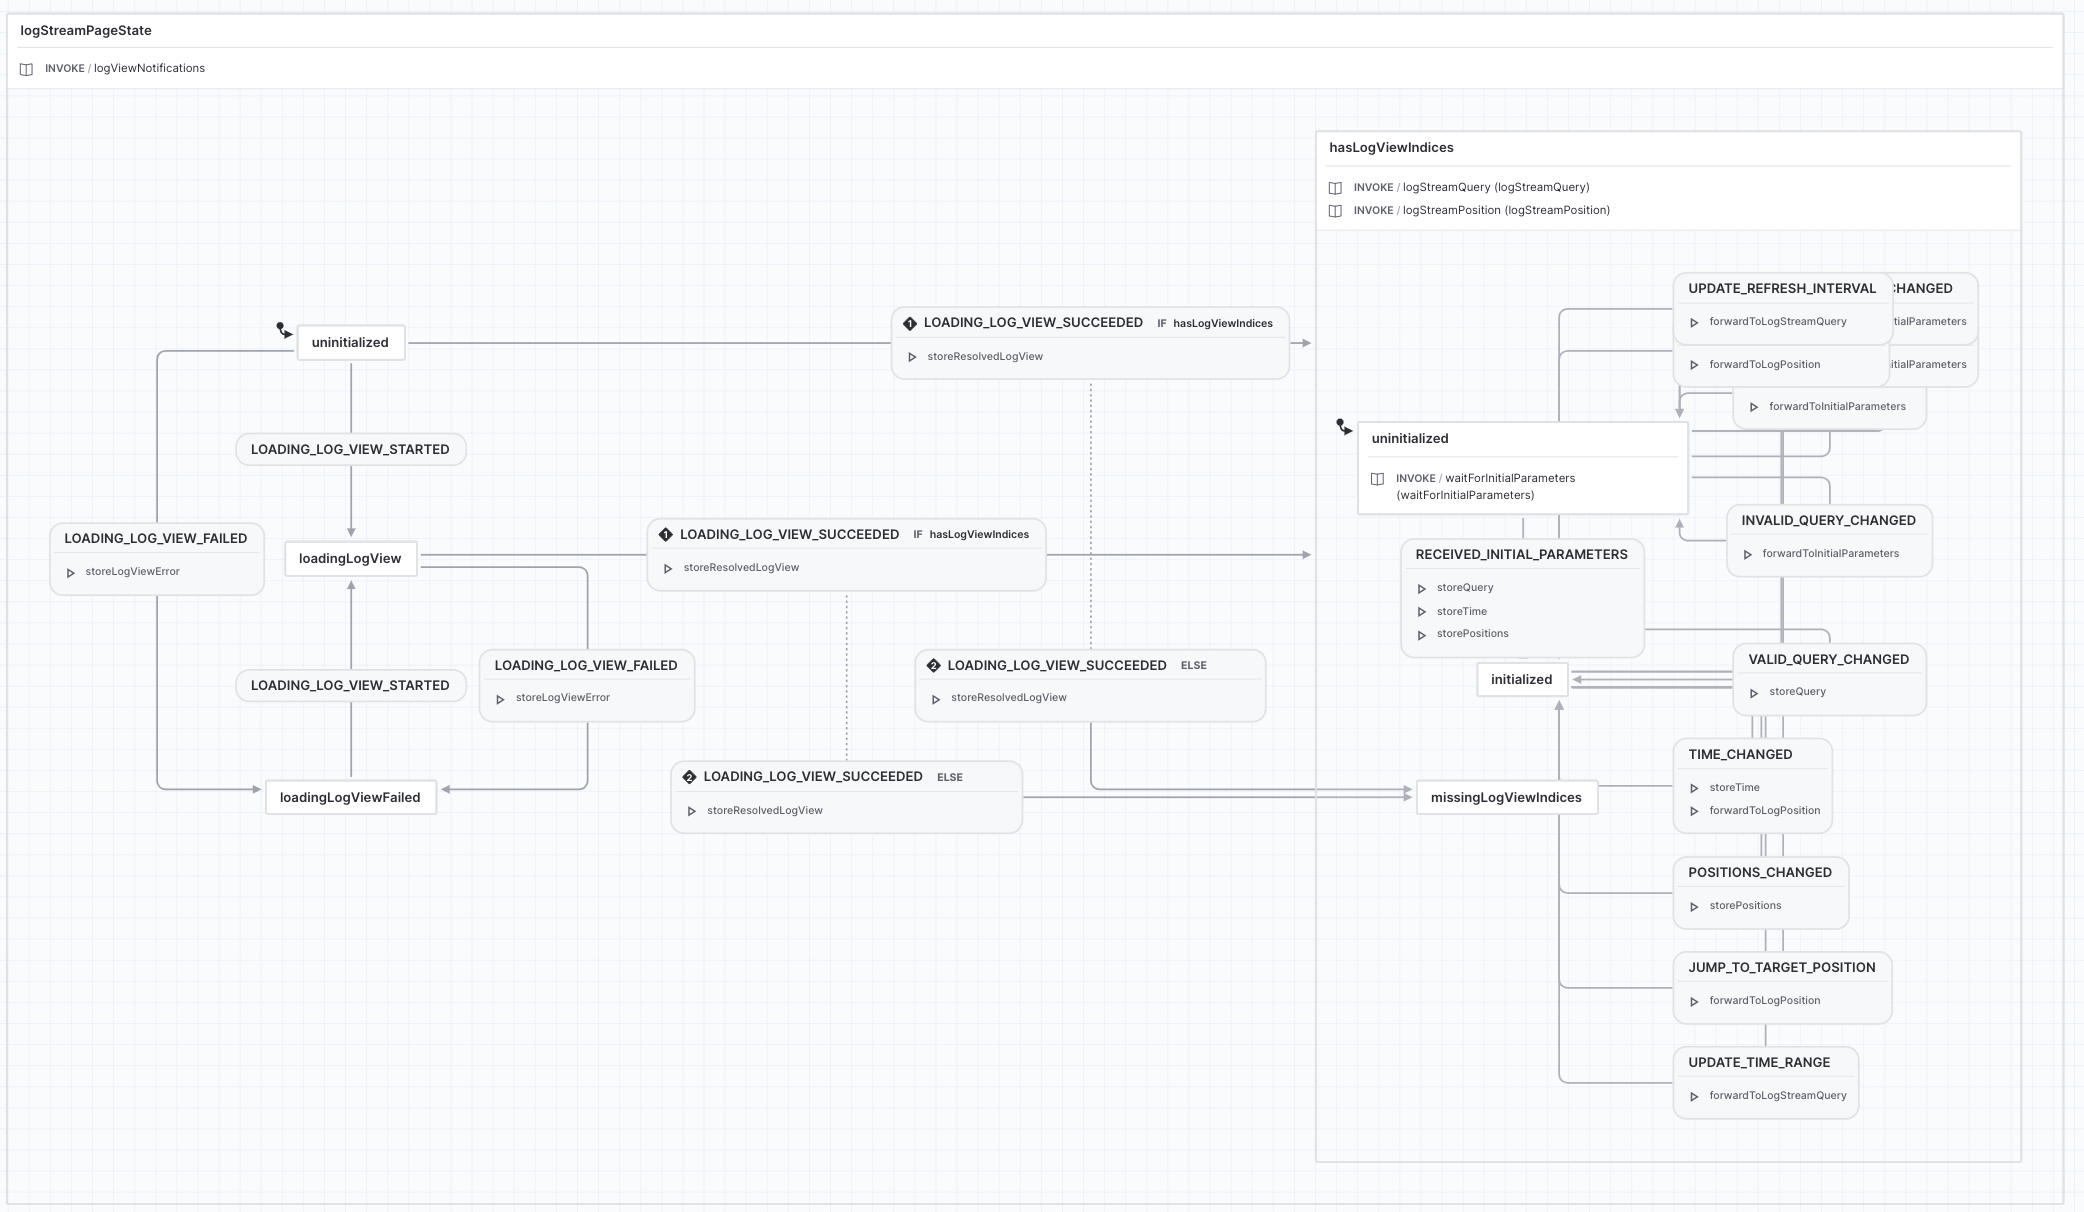
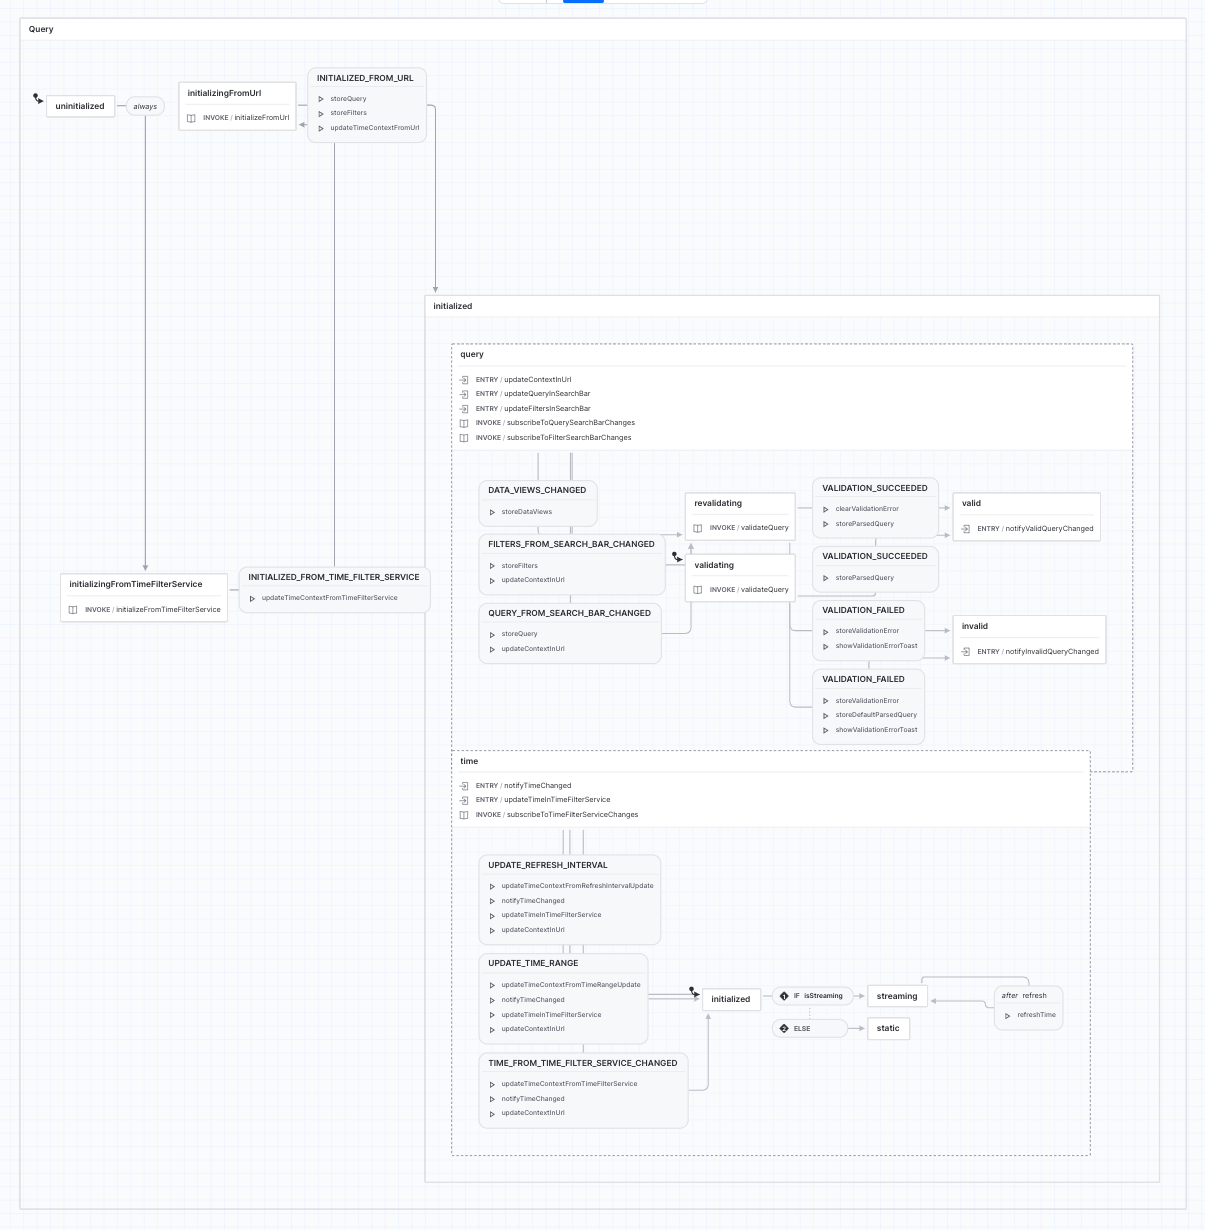
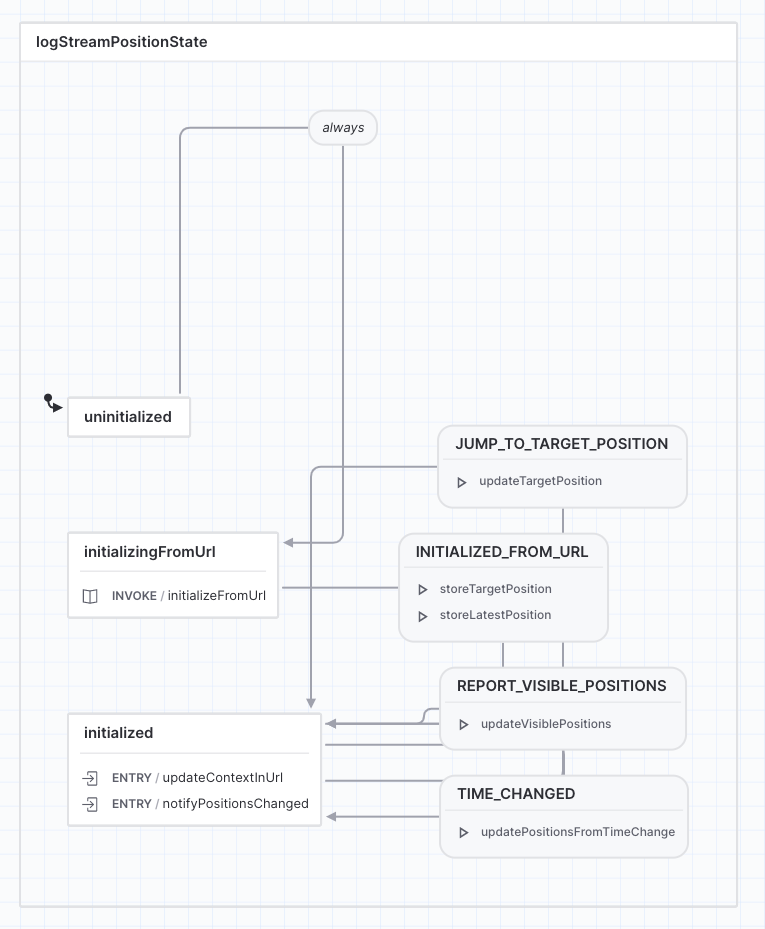
## 🎨 State machine diagrams
### Log stream page
### Log stream query
### Log stream position
## ⚠️ Warnings
- [There is a known bug with
streaming](https://github.com/elastic/kibana/issues/136159#issuecomment-1408902137).
- [There is a known issue with a console
error](https://github.com/elastic/kibana/pull/149052#issuecomment-1420579941)
---------
Co-authored-by: Felix Stürmer <weltenwort@users.noreply.github.com>
* Fully migrates metrics and logs to the NP

Co-authored-by: Jason Rhodes <jason.matthew.rhodes@gmail.com>
Co-authored-by: John Schulz <github.com@jfsiii.org>
Co-authored-by: Felix Stürmer <weltenwort@users.noreply.github.com>