# Backport

This will backport the following commits from `main` to `8.8`:
- [[Infrastructure UI] Hosts View: Unified Search bar with auto-refresh
enabled (#157011)](https://github.com/elastic/kibana/pull/157011)

<!--- Backport version: 8.9.7 -->

### Questions ?
Please refer to the [Backport tool
documentation](https://github.com/sqren/backport)

<!--BACKPORT
[{"author":{"name":"jennypavlova","email":"dzheni.pavlova@elastic.co"},"sourceCommit":{"committedDate":"2023-06-13T08:07:58Z","message":"[Infrastructure
UI] Hosts View: Unified Search bar with auto-refresh enabled
(#157011)\n\nCloses #156690 \r\n\r\n## Summary\r\n\r\nThis PR adds a
flag (`isAutoRefreshDisabled`) to disable the default\r\nauto-refresh
option in the unified search.\r\n\r\n## Background\r\n\r\nThe auto
refresh is added by default when using a unified search bar
in\r\n[defaultOnRefreshChange](https://github.com/elastic/kibana/blob/main/src/plugins/unified_search/public/search_bar/create_search_bar.tsx/#L59)\r\nand
it appeared on the host view page when currently the
auto-refresh\r\noption is not supported.\r\n\r\n\r\n| with
`isAutoRefreshDisabled` (true) | without
`isAutoRefreshDisabled`\r\n(false/undefined) |\r\n|
------------------------------------
|\r\n-------------------------------------------------- |\r\n| <img
width=\"200\"
alt=\"image\"\r\nsrc=\"https://user-images.githubusercontent.com/14139027/236862888-63efdb13-6b07-41c2-abe8-88247c9c96e1.png\">\r\n|
<img width=\"200\"
alt=\"image\"\r\nsrc=\"https://user-images.githubusercontent.com/14139027/236862409-4f36ec6a-f274-4dae-960b-407ea30f330b.png\">\r\n|\r\n\r\n---------\r\n\r\nCo-authored-by:
Stratoula Kalafateli
<efstratia.kalafateli@elastic.co>","sha":"77d864e4ff04027f800789259fd6c6194b51c59a","branchLabelMapping":{"^v8.9.0$":"main","^v(\\d+).(\\d+).\\d+$":"$1.$2"}},"sourcePullRequest":{"labels":["Team:Infra
Monitoring
UI","release_note:skip","backport:prev-minor","v8.9.0"],"number":157011,"url":"https://github.com/elastic/kibana/pull/157011","mergeCommit":{"message":"[Infrastructure
UI] Hosts View: Unified Search bar with auto-refresh enabled
(#157011)\n\nCloses #156690 \r\n\r\n## Summary\r\n\r\nThis PR adds a
flag (`isAutoRefreshDisabled`) to disable the default\r\nauto-refresh
option in the unified search.\r\n\r\n## Background\r\n\r\nThe auto
refresh is added by default when using a unified search bar
in\r\n[defaultOnRefreshChange](https://github.com/elastic/kibana/blob/main/src/plugins/unified_search/public/search_bar/create_search_bar.tsx/#L59)\r\nand
it appeared on the host view page when currently the
auto-refresh\r\noption is not supported.\r\n\r\n\r\n| with
`isAutoRefreshDisabled` (true) | without
`isAutoRefreshDisabled`\r\n(false/undefined) |\r\n|
------------------------------------
|\r\n-------------------------------------------------- |\r\n| <img
width=\"200\"
alt=\"image\"\r\nsrc=\"https://user-images.githubusercontent.com/14139027/236862888-63efdb13-6b07-41c2-abe8-88247c9c96e1.png\">\r\n|
<img width=\"200\"
alt=\"image\"\r\nsrc=\"https://user-images.githubusercontent.com/14139027/236862409-4f36ec6a-f274-4dae-960b-407ea30f330b.png\">\r\n|\r\n\r\n---------\r\n\r\nCo-authored-by:
Stratoula Kalafateli
<efstratia.kalafateli@elastic.co>","sha":"77d864e4ff04027f800789259fd6c6194b51c59a"}},"sourceBranch":"main","suggestedTargetBranches":[],"targetPullRequestStates":[{"branch":"main","label":"v8.9.0","labelRegex":"^v8.9.0$","isSourceBranch":true,"state":"MERGED","url":"https://github.com/elastic/kibana/pull/157011","number":157011,"mergeCommit":{"message":"[Infrastructure
UI] Hosts View: Unified Search bar with auto-refresh enabled
(#157011)\n\nCloses #156690 \r\n\r\n## Summary\r\n\r\nThis PR adds a
flag (`isAutoRefreshDisabled`) to disable the default\r\nauto-refresh
option in the unified search.\r\n\r\n## Background\r\n\r\nThe auto
refresh is added by default when using a unified search bar
in\r\n[defaultOnRefreshChange](https://github.com/elastic/kibana/blob/main/src/plugins/unified_search/public/search_bar/create_search_bar.tsx/#L59)\r\nand
it appeared on the host view page when currently the
auto-refresh\r\noption is not supported.\r\n\r\n\r\n| with
`isAutoRefreshDisabled` (true) | without
`isAutoRefreshDisabled`\r\n(false/undefined) |\r\n|
------------------------------------
|\r\n-------------------------------------------------- |\r\n| <img
width=\"200\"
alt=\"image\"\r\nsrc=\"https://user-images.githubusercontent.com/14139027/236862888-63efdb13-6b07-41c2-abe8-88247c9c96e1.png\">\r\n|
<img width=\"200\"
alt=\"image\"\r\nsrc=\"https://user-images.githubusercontent.com/14139027/236862409-4f36ec6a-f274-4dae-960b-407ea30f330b.png\">\r\n|\r\n\r\n---------\r\n\r\nCo-authored-by:
Stratoula Kalafateli
<efstratia.kalafateli@elastic.co>","sha":"77d864e4ff04027f800789259fd6c6194b51c59a"}}]}]
BACKPORT-->

Co-authored-by: jennypavlova <dzheni.pavlova@elastic.co>
# Backport

This will backport the following commits from `main` to `8.8`:
- [[Infrastructure UI] Filter control re-rendering problem fix
(#159320)](https://github.com/elastic/kibana/pull/159320)

<!--- Backport version: 8.9.7 -->

### Questions ?
Please refer to the [Backport tool
documentation](https://github.com/sqren/backport)

<!--BACKPORT [{"author":{"name":"Carlos
Crespo","email":"crespocarlos@users.noreply.github.com"},"sourceCommit":{"committedDate":"2023-06-12T12:30:23Z","message":"[Infrastructure
UI] Filter control re-rendering problem fix (#159320)\n\nfixes
https://github.com/elastic/kibana/issues/159317 \r\n\r\n##
Summary\r\n\r\nThis PR fixes a problem in the utilization of the
`ControlGroupRenderer`\r\ncomponent in the Hosts View. The problem
originated from the need to\r\nmanually compare changes in the
`filterPanel` object, to prevent the\r\npage from making duplicate
requests\r\n\r\n\r\nb38f5691-0519-4ae2-aab2-daaf0f72cd0d\r\n\r\nAfter
many changes that the code has been through, the comparison\r\nmentioned
above has become unnecessary.\r\n\r\n\r\n\r\n### How to test\r\n\r\n-
Start a local Kibana instance\r\n- Navigate to `Infrastructure >
Hosts`\r\n- Play with the filter controls (depending on how fast the
user is, it\r\nmight hang for a little while, but this won't slow the
whole page
down)","sha":"bcc4f11e0b97e991d94f5e6368dfa154f753d2ca","branchLabelMapping":{"^v8.9.0$":"main","^v(\\d+).(\\d+).\\d+$":"$1.$2"}},"sourcePullRequest":{"labels":["Feature:Metrics
UI","Team:Infra Monitoring
UI","release_note:skip","backport:prev-minor","Feature:ObsHosts","v8.9.0"],"number":159320,"url":"https://github.com/elastic/kibana/pull/159320","mergeCommit":{"message":"[Infrastructure
UI] Filter control re-rendering problem fix (#159320)\n\nfixes
https://github.com/elastic/kibana/issues/159317 \r\n\r\n##
Summary\r\n\r\nThis PR fixes a problem in the utilization of the
`ControlGroupRenderer`\r\ncomponent in the Hosts View. The problem
originated from the need to\r\nmanually compare changes in the
`filterPanel` object, to prevent the\r\npage from making duplicate
requests\r\n\r\n\r\nb38f5691-0519-4ae2-aab2-daaf0f72cd0d\r\n\r\nAfter
many changes that the code has been through, the comparison\r\nmentioned
above has become unnecessary.\r\n\r\n\r\n\r\n### How to test\r\n\r\n-
Start a local Kibana instance\r\n- Navigate to `Infrastructure >
Hosts`\r\n- Play with the filter controls (depending on how fast the
user is, it\r\nmight hang for a little while, but this won't slow the
whole page
down)","sha":"bcc4f11e0b97e991d94f5e6368dfa154f753d2ca"}},"sourceBranch":"main","suggestedTargetBranches":[],"targetPullRequestStates":[{"branch":"main","label":"v8.9.0","labelRegex":"^v8.9.0$","isSourceBranch":true,"state":"MERGED","url":"https://github.com/elastic/kibana/pull/159320","number":159320,"mergeCommit":{"message":"[Infrastructure
UI] Filter control re-rendering problem fix (#159320)\n\nfixes
https://github.com/elastic/kibana/issues/159317 \r\n\r\n##
Summary\r\n\r\nThis PR fixes a problem in the utilization of the
`ControlGroupRenderer`\r\ncomponent in the Hosts View. The problem
originated from the need to\r\nmanually compare changes in the
`filterPanel` object, to prevent the\r\npage from making duplicate
requests\r\n\r\n\r\nb38f5691-0519-4ae2-aab2-daaf0f72cd0d\r\n\r\nAfter
many changes that the code has been through, the comparison\r\nmentioned
above has become unnecessary.\r\n\r\n\r\n\r\n### How to test\r\n\r\n-
Start a local Kibana instance\r\n- Navigate to `Infrastructure >
Hosts`\r\n- Play with the filter controls (depending on how fast the
user is, it\r\nmight hang for a little while, but this won't slow the
whole page down)","sha":"bcc4f11e0b97e991d94f5e6368dfa154f753d2ca"}}]}]
BACKPORT-->

Co-authored-by: Carlos Crespo <crespocarlos@users.noreply.github.com>
# Backport

This will backport the following commits from `main` to `8.8`:
- [[Infrastructure UI] Remove sensitive info from telemetry payload
(#159314)](https://github.com/elastic/kibana/pull/159314)

<!--- Backport version: 8.9.7 -->

### Questions ?
Please refer to the [Backport tool
documentation](https://github.com/sqren/backport)

<!--BACKPORT [{"author":{"name":"Carlos
Crespo","email":"crespocarlos@users.noreply.github.com"},"sourceCommit":{"committedDate":"2023-06-09T07:58:08Z","message":"[Infrastructure
UI] Remove sensitive info from telemetry payload (#159314)\n\n##
Summary\r\n\r\nThis PR changes the `Hosts View Query Submitted`
telemetry event\r\npayload, stopping Kibana from sending potentially
sensitive information\r\nto analytics services.\r\n\r\nAn example of the
new payload:\r\n\r\n```ts\r\n{\r\n control_filter_fields:
['host.os.name'],\r\n filter_fields: ['host.name',
'cloud.provider'],\r\n interval: 'interval(now-1h)',\r\n with_query:
false,\r\n limit: 100,\r\n}\r\n```\r\n\r\nInstead of sending filter
values, we'll pass only the field names.\r\nExcept for the query bar,
because it's to complicated to parse and\r\nretrieve that
information\r\n\r\nCo-authored-by: Kibana Machine
<42973632+kibanamachine@users.noreply.github.com>","sha":"3bc3a362caa38427a849b2555ca0ad711bb870f1","branchLabelMapping":{"^v8.9.0$":"main","^v(\\d+).(\\d+).\\d+$":"$1.$2"}},"sourcePullRequest":{"labels":["Feature:Metrics
UI","Team:Infra Monitoring
UI","release_note:skip","backport:prev-minor","Feature:ObsHosts","v8.9.0"],"number":159314,"url":"https://github.com/elastic/kibana/pull/159314","mergeCommit":{"message":"[Infrastructure
UI] Remove sensitive info from telemetry payload (#159314)\n\n##
Summary\r\n\r\nThis PR changes the `Hosts View Query Submitted`
telemetry event\r\npayload, stopping Kibana from sending potentially
sensitive information\r\nto analytics services.\r\n\r\nAn example of the
new payload:\r\n\r\n```ts\r\n{\r\n control_filter_fields:
['host.os.name'],\r\n filter_fields: ['host.name',
'cloud.provider'],\r\n interval: 'interval(now-1h)',\r\n with_query:
false,\r\n limit: 100,\r\n}\r\n```\r\n\r\nInstead of sending filter
values, we'll pass only the field names.\r\nExcept for the query bar,
because it's to complicated to parse and\r\nretrieve that
information\r\n\r\nCo-authored-by: Kibana Machine
<42973632+kibanamachine@users.noreply.github.com>","sha":"3bc3a362caa38427a849b2555ca0ad711bb870f1"}},"sourceBranch":"main","suggestedTargetBranches":[],"targetPullRequestStates":[{"branch":"main","label":"v8.9.0","labelRegex":"^v8.9.0$","isSourceBranch":true,"state":"MERGED","url":"https://github.com/elastic/kibana/pull/159314","number":159314,"mergeCommit":{"message":"[Infrastructure
UI] Remove sensitive info from telemetry payload (#159314)\n\n##
Summary\r\n\r\nThis PR changes the `Hosts View Query Submitted`
telemetry event\r\npayload, stopping Kibana from sending potentially
sensitive information\r\nto analytics services.\r\n\r\nAn example of the
new payload:\r\n\r\n```ts\r\n{\r\n control_filter_fields:
['host.os.name'],\r\n filter_fields: ['host.name',
'cloud.provider'],\r\n interval: 'interval(now-1h)',\r\n with_query:
false,\r\n limit: 100,\r\n}\r\n```\r\n\r\nInstead of sending filter
values, we'll pass only the field names.\r\nExcept for the query bar,
because it's to complicated to parse and\r\nretrieve that
information\r\n\r\nCo-authored-by: Kibana Machine
<42973632+kibanamachine@users.noreply.github.com>","sha":"3bc3a362caa38427a849b2555ca0ad711bb870f1"}}]}]
BACKPORT-->

Co-authored-by: Carlos Crespo <crespocarlos@users.noreply.github.com>
# Backport
Closes#158930
This will backport the following commits from `main` to `8.8`:
- [[Logs UI] Fix Log Categorization UI failure due to infinite loop
(#159090)](https://github.com/elastic/kibana/pull/159090)
<!--- Backport version: 8.9.7 -->
### Questions ?
Please refer to the [Backport tool
documentation](https://github.com/sqren/backport)
<!--BACKPORT [{"author":{"name":"Marco Antonio
Ghiani","email":"marcoantonio.ghiani01@gmail.com"},"sourceCommit":{"committedDate":"2023-06-06T11:31:03Z","message":"[Logs
UI] Fix Log Categorization UI failure due to infinite loop
(#159090)\n\n## 📓 Summary\r\n\r\nWith the usage of the
`logViewReference` object (instead of the\r\nprimitive `sourceId`) as a
dependency for the log entries categories\r\ndata fetching, the
`useTrackedPromise` was continuously recreating
the\r\n`getLogEntryCategoryDatasets` and `getTopLogEntryCategories`
fetchers,\r\nwhich were consequently causing an infinite loop when
called inside the\r\nrelated side effect and used as
dependency.\r\n\r\nUsing the `logViewReference.logViewId` property
(equivalent to the\r\nlegacy `sourceId` string) restores the expected
behaviour.\r\n\r\nCo-authored-by: Marco Antonio Ghiani
<marcoantonio.ghiani@elastic.co>","sha":"d6105d0bfe0634a0543e52ce3c1275ad0bd64250","branchLabelMapping":{"^v8.9.0$":"main","^v(\\d+).(\\d+).\\d+$":"$1.$2"}},"sourcePullRequest":{"labels":["release_note:fix","Feature:Logs
UI","Team:Infra Monitoring
UI","backport:prev-minor","v8.9.0"],"number":159090,"url":"https://github.com/elastic/kibana/pull/159090","mergeCommit":{"message":"[Logs
UI] Fix Log Categorization UI failure due to infinite loop
(#159090)\n\n## 📓 Summary\r\n\r\nWith the usage of the
`logViewReference` object (instead of the\r\nprimitive `sourceId`) as a
dependency for the log entries categories\r\ndata fetching, the
`useTrackedPromise` was continuously recreating
the\r\n`getLogEntryCategoryDatasets` and `getTopLogEntryCategories`
fetchers,\r\nwhich were consequently causing an infinite loop when
called inside the\r\nrelated side effect and used as
dependency.\r\n\r\nUsing the `logViewReference.logViewId` property
(equivalent to the\r\nlegacy `sourceId` string) restores the expected
behaviour.\r\n\r\nCo-authored-by: Marco Antonio Ghiani
<marcoantonio.ghiani@elastic.co>","sha":"d6105d0bfe0634a0543e52ce3c1275ad0bd64250"}},"sourceBranch":"main","suggestedTargetBranches":[],"targetPullRequestStates":[{"branch":"main","label":"v8.9.0","labelRegex":"^v8.9.0$","isSourceBranch":true,"state":"MERGED","url":"https://github.com/elastic/kibana/pull/159090","number":159090,"mergeCommit":{"message":"[Logs
UI] Fix Log Categorization UI failure due to infinite loop
(#159090)\n\n## 📓 Summary\r\n\r\nWith the usage of the
`logViewReference` object (instead of the\r\nprimitive `sourceId`) as a
dependency for the log entries categories\r\ndata fetching, the
`useTrackedPromise` was continuously recreating
the\r\n`getLogEntryCategoryDatasets` and `getTopLogEntryCategories`
fetchers,\r\nwhich were consequently causing an infinite loop when
called inside the\r\nrelated side effect and used as
dependency.\r\n\r\nUsing the `logViewReference.logViewId` property
(equivalent to the\r\nlegacy `sourceId` string) restores the expected
behaviour.\r\n\r\nCo-authored-by: Marco Antonio Ghiani
<marcoantonio.ghiani@elastic.co>","sha":"d6105d0bfe0634a0543e52ce3c1275ad0bd64250"}}]}]
BACKPORT-->
Co-authored-by: Marco Antonio Ghiani <marcoantonio.ghiani01@gmail.com>
# Backport

This will backport the following commits from `main` to `8.8`:
- [[Infrastructure UI] Hosts view handle invalid KQL error
(#156989)](https://github.com/elastic/kibana/pull/156989)

<!--- Backport version: 8.9.7 -->

### Questions ?
Please refer to the [Backport tool
documentation](https://github.com/sqren/backport)

<!--BACKPORT [{"author":{"name":"Carlos
Crespo","email":"crespocarlos@users.noreply.github.com"},"sourceCommit":{"committedDate":"2023-05-11T16:59:23Z","message":"[Infrastructure
UI] Hosts view handle invalid KQL error (#156989)\n\ncloses
[#987](https://github.com/elastic/obs-infraobs-team/issues/987)\r\n\r\n##
Summary\r\n\r\nThis PR changes the hosts view to graciously handle
exceptions caused by\r\ninvalid KQL submissions\r\n\r\n<img
width=\"1451\"
alt=\"image\"\r\nsrc=\"5bafc987-9a14-4b03-9038-53179f7b6735\">\r\n\r\n\r\nBesides,
it changes the way it was handling a fatal error that can\r\nhappen if
something wrong happens while creating an ad-hoc data-view -\r\nthis is
highly unlike to happen, but we're standardizing how we
display\r\nerrors on the hosts view\r\n\r\n_Previously:_\r\n<img
width=\"1439\"
alt=\"image\"\r\nsrc=\"https://user-images.githubusercontent.com/2767137/236833673-c994512f-cb73-441b-9783-506bab67ff4b.png\">\r\n\r\n_Now:_\r\n<img
width=\"1439\"
alt=\"image\"\r\nsrc=\"https://user-images.githubusercontent.com/2767137/236862216-fada9f50-5d27-45b9-a6f3-8ac497a3e048.png\">\r\n\r\n###
How to test\r\n- Go to hosts view\r\n- Type invalid KQL expressions on
the search bar\r\n\r\n### For reviewer\r\n\r\nIf the page is loaded with
a querystring containing an invalid
`query`\r\n(e.g:\r\n`_a=(dateRange:(from:now-15m,to:now),filters:!(),limit:20,panelFilters:!(),query:(language:kuery,query:%27%7D%27)`),\r\nthe
Control components will show an error. However, they can't
recover\r\nfrom fatal errors. So even after the user corrects the
mistake in the\r\nquery, the controls will remain in the error
state.\r\n\r\nA ticket has been opened to address this
problem:\r\nhttps://github.com/elastic/kibana/issues/156430\r\n\r\n---------\r\n\r\nCo-authored-by:
Kibana Machine
<42973632+kibanamachine@users.noreply.github.com>","sha":"8baff25966d45c1b351e96a5cc524372b4dbdb29","branchLabelMapping":{"^v8.9.0$":"main","^v(\\d+).(\\d+).\\d+$":"$1.$2"}},"sourcePullRequest":{"labels":["Feature:Metrics
UI","Team:Infra Monitoring
UI","release_note:skip","backport:prev-minor","Feature:ObsHosts","v8.9.0"],"number":156989,"url":"https://github.com/elastic/kibana/pull/156989","mergeCommit":{"message":"[Infrastructure
UI] Hosts view handle invalid KQL error (#156989)\n\ncloses
[#987](https://github.com/elastic/obs-infraobs-team/issues/987)\r\n\r\n##
Summary\r\n\r\nThis PR changes the hosts view to graciously handle
exceptions caused by\r\ninvalid KQL submissions\r\n\r\n<img
width=\"1451\"
alt=\"image\"\r\nsrc=\"5bafc987-9a14-4b03-9038-53179f7b6735\">\r\n\r\n\r\nBesides,
it changes the way it was handling a fatal error that can\r\nhappen if
something wrong happens while creating an ad-hoc data-view -\r\nthis is
highly unlike to happen, but we're standardizing how we
display\r\nerrors on the hosts view\r\n\r\n_Previously:_\r\n<img
width=\"1439\"
alt=\"image\"\r\nsrc=\"https://user-images.githubusercontent.com/2767137/236833673-c994512f-cb73-441b-9783-506bab67ff4b.png\">\r\n\r\n_Now:_\r\n<img
width=\"1439\"
alt=\"image\"\r\nsrc=\"https://user-images.githubusercontent.com/2767137/236862216-fada9f50-5d27-45b9-a6f3-8ac497a3e048.png\">\r\n\r\n###
How to test\r\n- Go to hosts view\r\n- Type invalid KQL expressions on
the search bar\r\n\r\n### For reviewer\r\n\r\nIf the page is loaded with
a querystring containing an invalid
`query`\r\n(e.g:\r\n`_a=(dateRange:(from:now-15m,to:now),filters:!(),limit:20,panelFilters:!(),query:(language:kuery,query:%27%7D%27)`),\r\nthe
Control components will show an error. However, they can't
recover\r\nfrom fatal errors. So even after the user corrects the
mistake in the\r\nquery, the controls will remain in the error
state.\r\n\r\nA ticket has been opened to address this
problem:\r\nhttps://github.com/elastic/kibana/issues/156430\r\n\r\n---------\r\n\r\nCo-authored-by:
Kibana Machine
<42973632+kibanamachine@users.noreply.github.com>","sha":"8baff25966d45c1b351e96a5cc524372b4dbdb29"}},"sourceBranch":"main","suggestedTargetBranches":[],"targetPullRequestStates":[{"branch":"main","label":"v8.9.0","labelRegex":"^v8.9.0$","isSourceBranch":true,"state":"MERGED","url":"https://github.com/elastic/kibana/pull/156989","number":156989,"mergeCommit":{"message":"[Infrastructure
UI] Hosts view handle invalid KQL error (#156989)\n\ncloses
[#987](https://github.com/elastic/obs-infraobs-team/issues/987)\r\n\r\n##
Summary\r\n\r\nThis PR changes the hosts view to graciously handle
exceptions caused by\r\ninvalid KQL submissions\r\n\r\n<img
width=\"1451\"
alt=\"image\"\r\nsrc=\"5bafc987-9a14-4b03-9038-53179f7b6735\">\r\n\r\n\r\nBesides,
it changes the way it was handling a fatal error that can\r\nhappen if
something wrong happens while creating an ad-hoc data-view -\r\nthis is
highly unlike to happen, but we're standardizing how we
display\r\nerrors on the hosts view\r\n\r\n_Previously:_\r\n<img
width=\"1439\"
alt=\"image\"\r\nsrc=\"https://user-images.githubusercontent.com/2767137/236833673-c994512f-cb73-441b-9783-506bab67ff4b.png\">\r\n\r\n_Now:_\r\n<img
width=\"1439\"
alt=\"image\"\r\nsrc=\"https://user-images.githubusercontent.com/2767137/236862216-fada9f50-5d27-45b9-a6f3-8ac497a3e048.png\">\r\n\r\n###
How to test\r\n- Go to hosts view\r\n- Type invalid KQL expressions on
the search bar\r\n\r\n### For reviewer\r\n\r\nIf the page is loaded with
a querystring containing an invalid
`query`\r\n(e.g:\r\n`_a=(dateRange:(from:now-15m,to:now),filters:!(),limit:20,panelFilters:!(),query:(language:kuery,query:%27%7D%27)`),\r\nthe
Control components will show an error. However, they can't
recover\r\nfrom fatal errors. So even after the user corrects the
mistake in the\r\nquery, the controls will remain in the error
state.\r\n\r\nA ticket has been opened to address this
problem:\r\nhttps://github.com/elastic/kibana/issues/156430\r\n\r\n---------\r\n\r\nCo-authored-by:
Kibana Machine
<42973632+kibanamachine@users.noreply.github.com>","sha":"8baff25966d45c1b351e96a5cc524372b4dbdb29"}}]}]
BACKPORT-->

Co-authored-by: Carlos Crespo <crespocarlos@users.noreply.github.com>
# Backport
This will backport the following commits from `main` to `8.8`:
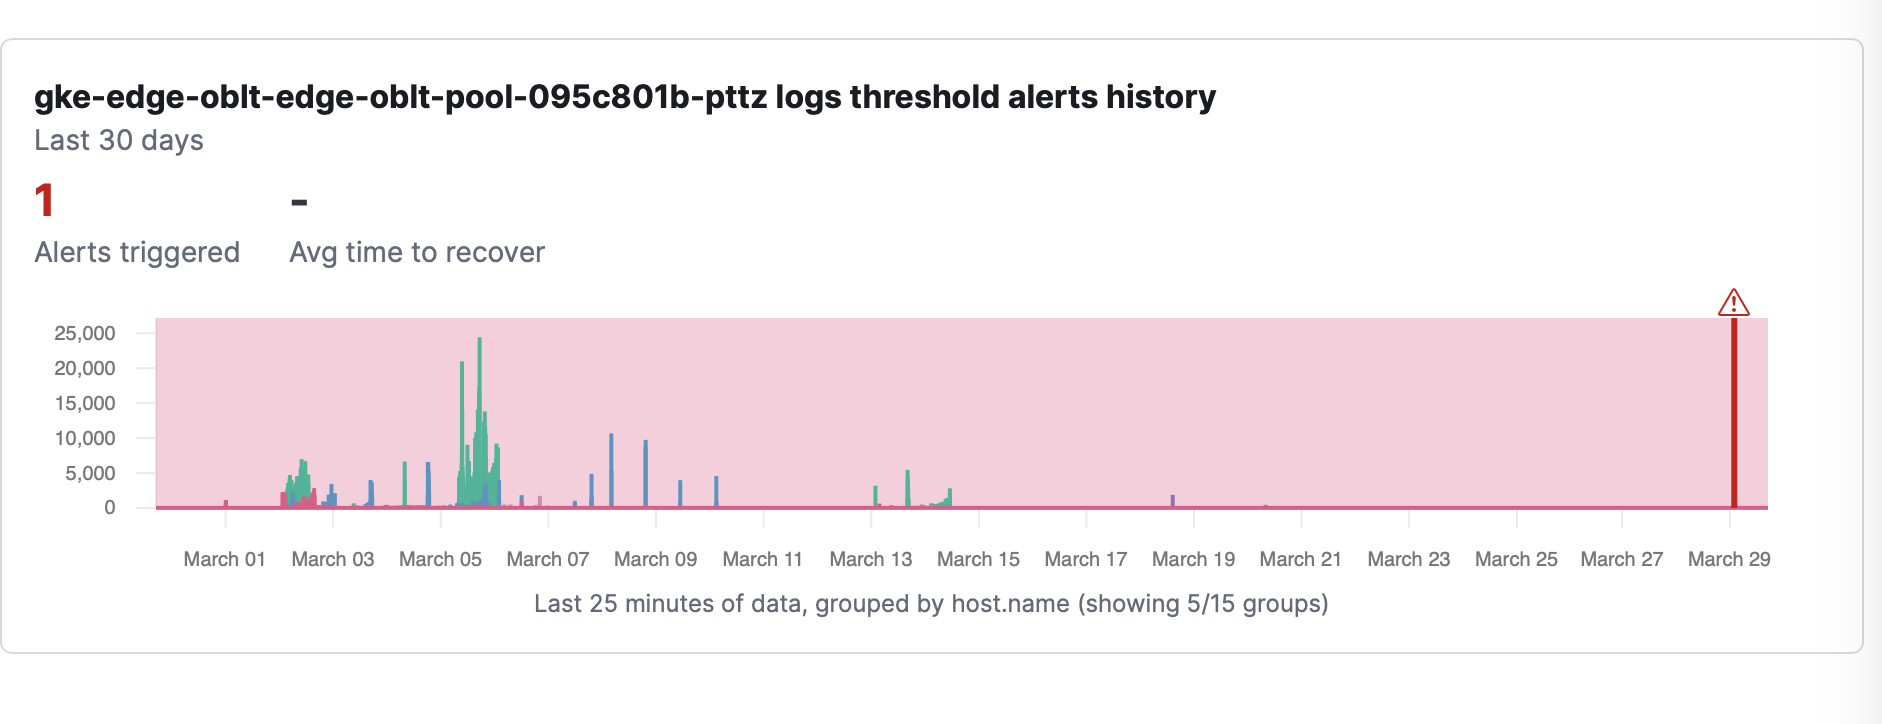
- [Fix the charts and group by section on the Log Threshold alert detail
page (#155327)](https://github.com/elastic/kibana/pull/155327)
<!--- Backport version: 8.9.7 -->
### Questions ?
Please refer to the [Backport tool
documentation](https://github.com/sqren/backport)
<!--BACKPORT [{"author":{"name":"Chris
Cowan","email":"chris@elastic.co"},"sourceCommit":{"committedDate":"2023-05-11T15:54:35Z","message":"Fix
the charts and group by section on the Log Threshold alert detail page
(#155327)\n\n## Summary\r\n\r\nThis PR fixes#155083 with the following
changes:\r\n\r\n- Create a new field to store the action context for an
alert under\r\n`ALERT_CONTEXT` (`kibana.alert.context`) for Log
Threshold Rule.\r\n- Change the alert detail page to reference the
`groupByKeys` under\r\n`ALERT_CONTEXT` for the group by section\r\n-
Change the history chart to only display `12h` buckets\r\n\r\nI plan to
do a follow up PR to add the ALERT_CONTEXT to the other\r\nObservability
Rules which we will also need for our alert details pages.\r\n\r\n###
How to test\r\n\r\n1. Index data
using:\r\nhttps://github.com/elastic/high-cardinality-cluster/tree/main/high_cardinality_indexer\r\nby
running the following command:\r\n```\r\nDATASET=\"fake_stack\"
EVENTS_PER_CYCLE=1 INDEX_INTERVAL=60000
ELASTICSEARCH_HOSTS=http://localhost:9200 node src/run.js\r\n```\r\n2.
Create a DataView for named \"Admin Console\" with the index pattern
of\r\n`high-cardinality-data-fake_stack.admin-console-*` and the
timestamp\r\nfield set to `@timestamp`\r\n3. Go to the Log Stream in
Observability and change the index pattern to\r\n\"Admin Console\"\r\n4.
Create a rule that looks like:\r\n\r\n<img width=\"600\"
alt=\"image\"\r\nsrc=\"https://user-images.githubusercontent.com/41702/232578891-e65a3f1a-457c-459a-8d7f-cadc85e7067c.png\">\r\n\r\n5.
Create a rule WITHOUT a group by that will trigger and check
the\r\nalert detail page\r\n6. Create a rule with a ratio WITHOUT a
group by that will trigger and\r\ncheck the alert detail page\r\n7.
Create a rule with a ratio WITH a group by that will trigger
and\r\ncheck the alert detail
page\r\n\r\n---------\r\n\r\nCo-authored-by: Kevin Delemme
<kdelemme@gmail.com>\r\nCo-authored-by: Kibana Machine
<42973632+kibanamachine@users.noreply.github.com>","sha":"78671f113cc68f5e1696bbe4aed2320978c97e11","branchLabelMapping":{"^v8.9.0$":"main","^v(\\d+).(\\d+).\\d+$":"$1.$2"}},"sourcePullRequest":{"labels":["release_note:skip","Team:
Actionable
Observability","v8.8.0","v8.9.0"],"number":155327,"url":"https://github.com/elastic/kibana/pull/155327","mergeCommit":{"message":"Fix
the charts and group by section on the Log Threshold alert detail page
(#155327)\n\n## Summary\r\n\r\nThis PR fixes#155083 with the following
changes:\r\n\r\n- Create a new field to store the action context for an
alert under\r\n`ALERT_CONTEXT` (`kibana.alert.context`) for Log
Threshold Rule.\r\n- Change the alert detail page to reference the
`groupByKeys` under\r\n`ALERT_CONTEXT` for the group by section\r\n-
Change the history chart to only display `12h` buckets\r\n\r\nI plan to
do a follow up PR to add the ALERT_CONTEXT to the other\r\nObservability
Rules which we will also need for our alert details pages.\r\n\r\n###
How to test\r\n\r\n1. Index data
using:\r\nhttps://github.com/elastic/high-cardinality-cluster/tree/main/high_cardinality_indexer\r\nby
running the following command:\r\n```\r\nDATASET=\"fake_stack\"
EVENTS_PER_CYCLE=1 INDEX_INTERVAL=60000
ELASTICSEARCH_HOSTS=http://localhost:9200 node src/run.js\r\n```\r\n2.
Create a DataView for named \"Admin Console\" with the index pattern
of\r\n`high-cardinality-data-fake_stack.admin-console-*` and the
timestamp\r\nfield set to `@timestamp`\r\n3. Go to the Log Stream in
Observability and change the index pattern to\r\n\"Admin Console\"\r\n4.
Create a rule that looks like:\r\n\r\n<img width=\"600\"
alt=\"image\"\r\nsrc=\"https://user-images.githubusercontent.com/41702/232578891-e65a3f1a-457c-459a-8d7f-cadc85e7067c.png\">\r\n\r\n5.
Create a rule WITHOUT a group by that will trigger and check
the\r\nalert detail page\r\n6. Create a rule with a ratio WITHOUT a
group by that will trigger and\r\ncheck the alert detail page\r\n7.
Create a rule with a ratio WITH a group by that will trigger
and\r\ncheck the alert detail
page\r\n\r\n---------\r\n\r\nCo-authored-by: Kevin Delemme
<kdelemme@gmail.com>\r\nCo-authored-by: Kibana Machine
<42973632+kibanamachine@users.noreply.github.com>","sha":"78671f113cc68f5e1696bbe4aed2320978c97e11"}},"sourceBranch":"main","suggestedTargetBranches":["8.8"],"targetPullRequestStates":[{"branch":"8.8","label":"v8.8.0","labelRegex":"^v(\\d+).(\\d+).\\d+$","isSourceBranch":false,"state":"NOT_CREATED"},{"branch":"main","label":"v8.9.0","labelRegex":"^v8.9.0$","isSourceBranch":true,"state":"MERGED","url":"https://github.com/elastic/kibana/pull/155327","number":155327,"mergeCommit":{"message":"Fix
the charts and group by section on the Log Threshold alert detail page
(#155327)\n\n## Summary\r\n\r\nThis PR fixes#155083 with the following
changes:\r\n\r\n- Create a new field to store the action context for an
alert under\r\n`ALERT_CONTEXT` (`kibana.alert.context`) for Log
Threshold Rule.\r\n- Change the alert detail page to reference the
`groupByKeys` under\r\n`ALERT_CONTEXT` for the group by section\r\n-
Change the history chart to only display `12h` buckets\r\n\r\nI plan to
do a follow up PR to add the ALERT_CONTEXT to the other\r\nObservability
Rules which we will also need for our alert details pages.\r\n\r\n###
How to test\r\n\r\n1. Index data
using:\r\nhttps://github.com/elastic/high-cardinality-cluster/tree/main/high_cardinality_indexer\r\nby
running the following command:\r\n```\r\nDATASET=\"fake_stack\"
EVENTS_PER_CYCLE=1 INDEX_INTERVAL=60000
ELASTICSEARCH_HOSTS=http://localhost:9200 node src/run.js\r\n```\r\n2.
Create a DataView for named \"Admin Console\" with the index pattern
of\r\n`high-cardinality-data-fake_stack.admin-console-*` and the
timestamp\r\nfield set to `@timestamp`\r\n3. Go to the Log Stream in
Observability and change the index pattern to\r\n\"Admin Console\"\r\n4.
Create a rule that looks like:\r\n\r\n<img width=\"600\"
alt=\"image\"\r\nsrc=\"https://user-images.githubusercontent.com/41702/232578891-e65a3f1a-457c-459a-8d7f-cadc85e7067c.png\">\r\n\r\n5.
Create a rule WITHOUT a group by that will trigger and check
the\r\nalert detail page\r\n6. Create a rule with a ratio WITHOUT a
group by that will trigger and\r\ncheck the alert detail page\r\n7.
Create a rule with a ratio WITH a group by that will trigger
and\r\ncheck the alert detail
page\r\n\r\n---------\r\n\r\nCo-authored-by: Kevin Delemme
<kdelemme@gmail.com>\r\nCo-authored-by: Kibana Machine
<42973632+kibanamachine@users.noreply.github.com>","sha":"78671f113cc68f5e1696bbe4aed2320978c97e11"}}]}]
BACKPORT-->
Co-authored-by: Chris Cowan <chris@elastic.co>
# Backport

This will backport the following commits from `main` to `8.8`:
- [[Infrastructure UI] Host limit telemetry
(#155726)](https://github.com/elastic/kibana/pull/155726)

<!--- Backport version: 8.9.7 -->

### Questions ?
Please refer to the [Backport tool
documentation](https://github.com/sqren/backport)

<!--BACKPORT [{"author":{"name":"Carlos
Crespo","email":"crespocarlos@users.noreply.github.com"},"sourceCommit":{"committedDate":"2023-05-11T15:44:38Z","message":"[Infrastructure
UI] Host limit telemetry (#155726)\n\ncloses:
https://github.com/elastic/kibana/issues/155567\r\n\r\n##
Summary\r\n\r\nThis PR adds a new custom event to track the total number
of hosts, as\r\nwell as adjusts a few `data-test-subj` attribute values
to meet the\r\nnaming convention defined in the
observability-dev\r\n[docs](https://github.com/elastic/observability-dev/blob/main/docs/how-we-work/telemetry/telemetry-convention.md#naming-convention)\r\n\r\n\r\n###
For Reviewers\r\n\r\nAn option for not allowing yet a new custom event
in FS could be\r\ntriggering the new custom events only for self-managed
customers, and in\r\nFS watch the element that holds the total number of
hosts. But for now,\r\nI decided to allow the new custom event in FS for
consistency\r\n\r\n---------\r\n\r\nCo-authored-by: Kibana Machine
<42973632+kibanamachine@users.noreply.github.com>","sha":"937912b056f5876247f27a7baad5314401e65939","branchLabelMapping":{"^v8.9.0$":"main","^v(\\d+).(\\d+).\\d+$":"$1.$2"}},"sourcePullRequest":{"labels":["Feature:Metrics
UI","Team:Infra Monitoring
UI","release_note:skip","backport:prev-minor","Feature:ObsHosts","v8.9.0"],"number":155726,"url":"https://github.com/elastic/kibana/pull/155726","mergeCommit":{"message":"[Infrastructure
UI] Host limit telemetry (#155726)\n\ncloses:
https://github.com/elastic/kibana/issues/155567\r\n\r\n##
Summary\r\n\r\nThis PR adds a new custom event to track the total number
of hosts, as\r\nwell as adjusts a few `data-test-subj` attribute values
to meet the\r\nnaming convention defined in the
observability-dev\r\n[docs](https://github.com/elastic/observability-dev/blob/main/docs/how-we-work/telemetry/telemetry-convention.md#naming-convention)\r\n\r\n\r\n###
For Reviewers\r\n\r\nAn option for not allowing yet a new custom event
in FS could be\r\ntriggering the new custom events only for self-managed
customers, and in\r\nFS watch the element that holds the total number of
hosts. But for now,\r\nI decided to allow the new custom event in FS for
consistency\r\n\r\n---------\r\n\r\nCo-authored-by: Kibana Machine
<42973632+kibanamachine@users.noreply.github.com>","sha":"937912b056f5876247f27a7baad5314401e65939"}},"sourceBranch":"main","suggestedTargetBranches":[],"targetPullRequestStates":[{"branch":"main","label":"v8.9.0","labelRegex":"^v8.9.0$","isSourceBranch":true,"state":"MERGED","url":"https://github.com/elastic/kibana/pull/155726","number":155726,"mergeCommit":{"message":"[Infrastructure
UI] Host limit telemetry (#155726)\n\ncloses:
https://github.com/elastic/kibana/issues/155567\r\n\r\n##
Summary\r\n\r\nThis PR adds a new custom event to track the total number
of hosts, as\r\nwell as adjusts a few `data-test-subj` attribute values
to meet the\r\nnaming convention defined in the
observability-dev\r\n[docs](https://github.com/elastic/observability-dev/blob/main/docs/how-we-work/telemetry/telemetry-convention.md#naming-convention)\r\n\r\n\r\n###
For Reviewers\r\n\r\nAn option for not allowing yet a new custom event
in FS could be\r\ntriggering the new custom events only for self-managed
customers, and in\r\nFS watch the element that holds the total number of
hosts. But for now,\r\nI decided to allow the new custom event in FS for
consistency\r\n\r\n---------\r\n\r\nCo-authored-by: Kibana Machine
<42973632+kibanamachine@users.noreply.github.com>","sha":"937912b056f5876247f27a7baad5314401e65939"}}]}]
BACKPORT-->

Co-authored-by: Carlos Crespo <crespocarlos@users.noreply.github.com>
# Backport

This will backport the following commits from `main` to `8.8`:
- [[Logs/APM] Get context menu items from triggers
(#157131)](https://github.com/elastic/kibana/pull/157131)

<!--- Backport version: 7.3.2 -->

### Questions ?
Please refer to the [Backport tool
documentation](https://github.com/sqren/backport)

<!--BACKPORT {commits} BACKPORT-->
# Backport

This will backport the following commits from `main` to `8.8`:
- [[Infrastructure UI] Fix Lens charts for APM hosts
(#156372)](https://github.com/elastic/kibana/pull/156372)

<!--- Backport version: 8.9.7 -->

### Questions ?
Please refer to the [Backport tool
documentation](https://github.com/sqren/backport)

<!--BACKPORT [{"author":{"name":"Carlos
Crespo","email":"crespocarlos@users.noreply.github.com"},"sourceCommit":{"committedDate":"2023-05-02T13:56:06Z","message":"[Infrastructure
UI] Fix Lens charts for APM hosts (#156372)\n\n## Summary\r\n\r\nAfter
the implementation of the new API and host limit, all charts now\r\nload
only after the table is loaded. This PR changes the filters the\r\npage
currently passes to Lens, to pass only a list of host names, the\r\nsame
way Alerts and Logs tabs do it.\r\n\r\nThis also fixes a problem where
filters remove documents containing\r\nmetrics data.\r\n\r\n\r\n<img
width=\"772\"
alt=\"image\"\r\nsrc=\"https://user-images.githubusercontent.com/2767137/235683301-35709698-49c2-4871-a724-2d2ca662f3f2.png\">\r\n\r\n<img
width=\"772\"
alt=\"image\"\r\nsrc=\"https://user-images.githubusercontent.com/2767137/235683956-f7170213-afbd-400d-a190-a02087831af1.png\">\r\n\r\n\r\n\r\n\r\n###
How to test\r\n\r\n- Connect your local kibana to an oblt cluster\r\n-
Go to Hosts view\r\n- Filter by `service.name:
\"opbeans-java\"`","sha":"e9804277b20320e37dde3ceaaa6f9ae1b66e3b23","branchLabelMapping":{"^v8.9.0$":"main","^v(\\d+).(\\d+).\\d+$":"$1.$2"}},"sourcePullRequest":{"labels":["Feature:Metrics
UI","Team:Infra Monitoring
UI","release_note:skip","backport:prev-minor","Feature:ObsHosts","v8.9.0"],"number":156372,"url":"https://github.com/elastic/kibana/pull/156372","mergeCommit":{"message":"[Infrastructure
UI] Fix Lens charts for APM hosts (#156372)\n\n## Summary\r\n\r\nAfter
the implementation of the new API and host limit, all charts now\r\nload
only after the table is loaded. This PR changes the filters the\r\npage
currently passes to Lens, to pass only a list of host names, the\r\nsame
way Alerts and Logs tabs do it.\r\n\r\nThis also fixes a problem where
filters remove documents containing\r\nmetrics data.\r\n\r\n\r\n<img
width=\"772\"
alt=\"image\"\r\nsrc=\"https://user-images.githubusercontent.com/2767137/235683301-35709698-49c2-4871-a724-2d2ca662f3f2.png\">\r\n\r\n<img
width=\"772\"
alt=\"image\"\r\nsrc=\"https://user-images.githubusercontent.com/2767137/235683956-f7170213-afbd-400d-a190-a02087831af1.png\">\r\n\r\n\r\n\r\n\r\n###
How to test\r\n\r\n- Connect your local kibana to an oblt cluster\r\n-
Go to Hosts view\r\n- Filter by `service.name:
\"opbeans-java\"`","sha":"e9804277b20320e37dde3ceaaa6f9ae1b66e3b23"}},"sourceBranch":"main","suggestedTargetBranches":[],"targetPullRequestStates":[{"branch":"main","label":"v8.9.0","labelRegex":"^v8.9.0$","isSourceBranch":true,"state":"MERGED","url":"https://github.com/elastic/kibana/pull/156372","number":156372,"mergeCommit":{"message":"[Infrastructure
UI] Fix Lens charts for APM hosts (#156372)\n\n## Summary\r\n\r\nAfter
the implementation of the new API and host limit, all charts now\r\nload
only after the table is loaded. This PR changes the filters the\r\npage
currently passes to Lens, to pass only a list of host names, the\r\nsame
way Alerts and Logs tabs do it.\r\n\r\nThis also fixes a problem where
filters remove documents containing\r\nmetrics data.\r\n\r\n\r\n<img
width=\"772\"
alt=\"image\"\r\nsrc=\"https://user-images.githubusercontent.com/2767137/235683301-35709698-49c2-4871-a724-2d2ca662f3f2.png\">\r\n\r\n<img
width=\"772\"
alt=\"image\"\r\nsrc=\"https://user-images.githubusercontent.com/2767137/235683956-f7170213-afbd-400d-a190-a02087831af1.png\">\r\n\r\n\r\n\r\n\r\n###
How to test\r\n\r\n- Connect your local kibana to an oblt cluster\r\n-
Go to Hosts view\r\n- Filter by `service.name:
\"opbeans-java\"`","sha":"e9804277b20320e37dde3ceaaa6f9ae1b66e3b23"}}]}]
BACKPORT-->

Co-authored-by: Carlos Crespo <crespocarlos@users.noreply.github.com>
# Backport
This will backport the following commits from `main` to `8.8`:
- [[Infarstructure UI] Fix hosts view functional test
(#155772)](https://github.com/elastic/kibana/pull/155772)
<!--- Backport version: 8.9.7 -->
### Questions ?
Please refer to the [Backport tool
documentation](https://github.com/sqren/backport)
<!--BACKPORT [{"author":{"name":"Carlos
Crespo","email":"crespocarlos@users.noreply.github.com"},"sourceCommit":{"committedDate":"2023-05-02T11:40:48Z","message":"[Infarstructure
UI] Fix hosts view functional test (#155772)\n\ncloses
https://github.com/elastic/kibana/issues/155429\r\ncloseshttps://github.com/elastic/kibana/issues/155293\r\n\r\n##
Summary\r\n\r\n\r\nThis PR fixes the hosts view functional test,
stabilizing the flaky test\r\ncases that started to fail after changes
were made to the page\r\n\r\n\r\n### How to test\r\n\r\n- `yarn
test:ftr:server
--config\r\nx-pack/test/functional/apps/infra/config.ts`\r\n- `yarn
test:ftr:runner --config\r\nx-pack/test/functional/apps/infra/config.ts
--include\r\nx-pack/test/functional/apps/infra/hosts_view.ts`\r\n\r\n---------\r\n\r\nCo-authored-by:
Kibana Machine
<42973632+kibanamachine@users.noreply.github.com>","sha":"c4669323f7a1a781eaa2eaddab74971c480c80e8","branchLabelMapping":{"^v8.9.0$":"main","^v(\\d+).(\\d+).\\d+$":"$1.$2"}},"sourcePullRequest":{"labels":["Feature:Metrics
UI","Team:Infra Monitoring
UI","release_note:skip","backport:prev-minor","Feature:ObsHosts","v8.9.0"],"number":155772,"url":"https://github.com/elastic/kibana/pull/155772","mergeCommit":{"message":"[Infarstructure
UI] Fix hosts view functional test (#155772)\n\ncloses
https://github.com/elastic/kibana/issues/155429\r\ncloseshttps://github.com/elastic/kibana/issues/155293\r\n\r\n##
Summary\r\n\r\n\r\nThis PR fixes the hosts view functional test,
stabilizing the flaky test\r\ncases that started to fail after changes
were made to the page\r\n\r\n\r\n### How to test\r\n\r\n- `yarn
test:ftr:server
--config\r\nx-pack/test/functional/apps/infra/config.ts`\r\n- `yarn
test:ftr:runner --config\r\nx-pack/test/functional/apps/infra/config.ts
--include\r\nx-pack/test/functional/apps/infra/hosts_view.ts`\r\n\r\n---------\r\n\r\nCo-authored-by:
Kibana Machine
<42973632+kibanamachine@users.noreply.github.com>","sha":"c4669323f7a1a781eaa2eaddab74971c480c80e8"}},"sourceBranch":"main","suggestedTargetBranches":[],"targetPullRequestStates":[{"branch":"main","label":"v8.9.0","labelRegex":"^v8.9.0$","isSourceBranch":true,"state":"MERGED","url":"https://github.com/elastic/kibana/pull/155772","number":155772,"mergeCommit":{"message":"[Infarstructure
UI] Fix hosts view functional test (#155772)\n\ncloses
https://github.com/elastic/kibana/issues/155429\r\ncloseshttps://github.com/elastic/kibana/issues/155293\r\n\r\n##
Summary\r\n\r\n\r\nThis PR fixes the hosts view functional test,
stabilizing the flaky test\r\ncases that started to fail after changes
were made to the page\r\n\r\n\r\n### How to test\r\n\r\n- `yarn
test:ftr:server
--config\r\nx-pack/test/functional/apps/infra/config.ts`\r\n- `yarn
test:ftr:runner --config\r\nx-pack/test/functional/apps/infra/config.ts
--include\r\nx-pack/test/functional/apps/infra/hosts_view.ts`\r\n\r\n---------\r\n\r\nCo-authored-by:
Kibana Machine
<42973632+kibanamachine@users.noreply.github.com>","sha":"c4669323f7a1a781eaa2eaddab74971c480c80e8"}}]}]
BACKPORT-->
Co-authored-by: Carlos Crespo <crespocarlos@users.noreply.github.com>
## 📓 Summary
Depends on #154900Closes#155110
This PR implements the `InventoryViewsService` and
`InventoryViewsClient`, injecting an instance of the client in the
KibanaContextForPlugin and exposing so a set of utilities to
retrieve/update inventory views:
- `findInventoryViews`
- `getInventoryView`
- `createInventoryView`
- `updateInventoryView`
- `deleteInventoryView`
## 👣 Next steps
- Implement #154725 to consume the service
---------
Co-authored-by: Marco Antonio Ghiani <marcoantonio.ghiani@elastic.co>
Co-authored-by: kibanamachine <42973632+kibanamachine@users.noreply.github.com>
## 📓  Summary

Part of #152617

This PR does some refactoring on the presentational components used to
render the saved views on both Infra Inventory and Metrics Explorer,
preparing for the additional work required once [[Infrastructure UI]
Saved object hooks that use the SO client are removed in favour of the
new endpoints#154725](https://github.com/elastic/kibana/issues/154725)
will be implemented.

## 🐞 Bug fixes

While working on this code, some pre-existing issues have been
discovered and fixed:
- "Make default" star icon was not aligned correctly when rendered
alone:
<img width="751" alt="Screenshot 2023-04-19 at 15 22 24"
src="https://user-images.githubusercontent.com/34506779/233088425-34992395-4d18-46bc-9124-5d99101406ce.png">

- Delete view confirm prompt not closed after removing a view:


https://user-images.githubusercontent.com/34506779/233088780-9b1bfe57-170c-4e66-9303-f41448eb8447.mov

---------

Co-authored-by: Marco Antonio Ghiani <marcoantonio.ghiani@elastic.co>
Co-authored-by: kibanamachine <42973632+kibanamachine@users.noreply.github.com>
Closes#153740, closes#153833, closes#155593
This PR adds threshold information and rule name to the metric threshold
alert details page.

## 🧪 How to test
- Add xpack.observability.unsafe.alertDetails.metrics.enabled: true to
the Kibana config
- Create a metric threshold rule with multiple conditions that generates
an alert
- Go to the alert details page and check threshold information
- Click on the rule link; it should send you to the rule page
closes [#154443](https://github.com/elastic/kibana/issues/154443)
## Summary

This PR replaces the usage of the Snapshot API in favor of the new
`metrics/infra` endpoint and also includes a new control in the Search
Bar to allow users to select how many hosts they want the API to return.


https://user-images.githubusercontent.com/2767137/233728658-bccc7258-6955-47fb-8f7b-85ef6ec5d0f9.mov

Because the KPIs now needs to show an "Average (of X hosts)", they will
only start fetching the data once the table has been loaded.

The hosts count KPI tile was not converted to Lens, because the page
needs to know the total number of hosts.

### Possible follow-up

Since now everything depends on the table to be loaded, I have been
experimenting with batched requests to the new API. The idea is to fetch
at least the host names as soon as possible.

---------

Co-authored-by: kibanamachine <42973632+kibanamachine@users.noreply.github.com>
closes [#152186](https://github.com/elastic/kibana/issues/152186)

## Summary

This PR makes the metric charts show data for the hosts on the current
page. With this change, the charts will **only** load after the table
has finished loading its data - or after Snapshot API has responded

It also changes the current behavior of the table pagination and
sorting. Instead of relying on the `EuiInMemoryTable` the pagination and
sorting are done manually, and the EuiInMemoryTable has been replaced by
the `EuiBasicTable`.

The loading indicator has also been replaced.

Paginating and sorting:


https://user-images.githubusercontent.com/2767137/233161166-2bd719e1-7259-4ecc-96a7-50493bc6c0a3.mov

Open in lens


https://user-images.githubusercontent.com/2767137/233161134-621afd76-44b5-42ab-b58c-7f51ef944ac2.mov


### How to test
- Go to Hosts view
- Paginate and sort the table data
- Select a page size and check if the select has been stored in the
localStorage (`hostsView:pageSizeSelection` key)

---------

Co-authored-by: Kibana Machine <42973632+kibanamachine@users.noreply.github.com>
Closes#155354
## Summary
This PR syncs chart pointers on the metric threshold alert details page.

## 🧪 How to test
- Add `xpack.observability.unsafe.alertDetails.metrics.enabled: true` to
the Kibana config
- Create a metric threshold rule with multiple conditions that generates
an alert
- Go to the alert details page and check the chart pointers
Closes#154564
## Summary
This PR removes the flyout state from the URL if the flyout is closed
and set the default state if the flyout is open again
## Testing
- Open a single host flyout and change the tab/add filter or search (do
not close the flyout yet)
- Copy the URL and verify that you see the same flyout data in a new
browser tab/window
- Close the flyout
- Check the URL (the flyout state should not be there)
- Copy the URL and verify that you see the flyout data is not there
(flyout is still closed and when it's open it has default state
(metadata page open)
- if there are any metadata filters applied they should still be part of
the unified search bar
https://user-images.githubusercontent.com/14139027/233397203-d99fc04a-a118-43f8-a43b-6b01d34ab3b8.mov
Aligns the Portable Dashboard renderer and the Control Group renderer to a new API structure using `useImperativeHandle` rather than the overcomplicated and mostly unused wrapper provider system.
## 📓 Summary
Closes#153890
The implementation creates a new LogsApp service where we should keep
any logic concerned with what `target_app` parameter is configured and
the actions related to a specific configuration. I thought it could be a
good approach to avoid drilling down the global config till we need it
and keep it cleaner by injecting only the service with predefined
actions.
In this first case, we create a redirect to discover using its locator,
and the exposed method can be used anywhere across the app for
triggering the redirect.
## 🧪 Testing
### Normal behaviour
When Kibana is used as always, we want to keep the current behaviour and
the user will stay on the Logs UI pages.
- Launch the Kibana dev environment with `yarn start`
- Navigate to Logs UI
- Verify the navigation works normally and that no redirect to Discover
occurs
### Serverless behaviour
When Kibana is used in serverless mode, we want to redirect any user
landing to Logs UI to the Discover page, configuring the same data view
or creating an ad-hoc one starting from the index pattern
- Launch the Kibana dev environment with `yarn serverless-oblt`
- Navigate to Logs UI
- Verify to be redirected to Discover and a temporary data view is
created from the current index pattern
---------
Co-authored-by: Marco Antonio Ghiani <marcoantonio.ghiani@elastic.co>
Co-authored-by: kibanamachine <42973632+kibanamachine@users.noreply.github.com>
## Summary

This PR replaces all but Host Count metric charts with Lens and aligns
the formulas used in Lens with the formulas used in the Snapshot API.

The Hosts Count was not converted yet, because Snapshot API
[post-process the results and filters out hosts that don't have metrics
and come from
APM](47c71b3025/x-pack/plugins/infra/server/routes/snapshot/lib/transform_metrics_ui_response.ts (L61)).
I decided to keep it unchanged until we start using a new API, which
won't have that step.

In order to avoid multiple requests going to the server simultaneously,
I introduced an intersection observer in the Lens chart component. It
will make them only trigger a request once the user has scrolled over a
chart component. This aims to prevent the occurrence of
`circuit_breaking_exception` exceptions when async_search has to process
too much data.

### Differences between Lens and current KPI charts

<img width="533" alt="image"
src="https://user-images.githubusercontent.com/2767137/232526591-4812059e-ba1f-4e59-a060-820570230084.png">

Currently, Lens doesn't provide an option for adding a suffix to the
metric value nor set a max number of decimal places. (e.g (e.g 3.8 Mbit
**/s**)

### For reviewer

Unfortunately, it's a big PR. Everything in the `lens/formulas` folder
is just related to the metric formulas that are reused between KPIs and
Metrics Charts.

The core of the changes is in the `lens/visualization_types` folder. It
contains the details on how to build different objects to render either
a metric type of chart or a lineXY one.

I have also aligned `cpu` and `memory` formulas with what we have in the
Inventory Model. When comparing the current KPI with the new ones in
Lens Embeddable, the results were not matching.

---------

Co-authored-by: Kibana Machine <42973632+kibanamachine@users.noreply.github.com>
## 📓 Summary
Closes#151700
As shown in the video on [this
comment](https://github.com/elastic/kibana/issues/151700#issuecomment-1497246729),
the issue was reproduced when jumping to the lowest possible edge of the
available logs in the lateral timeline.
In case there are no existing logs before the selected time cursor, the
`topCursor` value required for the previous logs call is set to `null`
and the error was triggered.
I believe in this case the conditional to trigger the error should not
only rely on the missing `topCursor` variable existence, but we should
also check whether previous logs exist with the `hasMoreBefore` state
value.
These are the conditionals in order of execution:
- Top cursor missing but has more previous entries ➡️ trigger the Error
- No more previous entries and the request is not forced ➡️ Short
circuit data fetching
- Top cursor exists => Trigger the request for previous entries.
These changes also spotted an existing bug where the `hasMoreBefore` was
never set to the API response value, but was always `true`, preventing
also showing the "Expand time range" call to action on the scenario
described above.
## 🧪 Testing
- Navigate to Logs stream
- Jump to a point in time that has no logs previously ingested
- Verify the error is not logged when scrolling and that the "extend
range" button is shown
https://user-images.githubusercontent.com/34506779/230292210-c2690c37-efa1-4b05-a237-f14eb78d26eb.mov
---------
Co-authored-by: Marco Antonio Ghiani <marcoantonio.ghiani@elastic.co>
Co-authored-by: Carlos Crespo <crespocarlos@users.noreply.github.com>
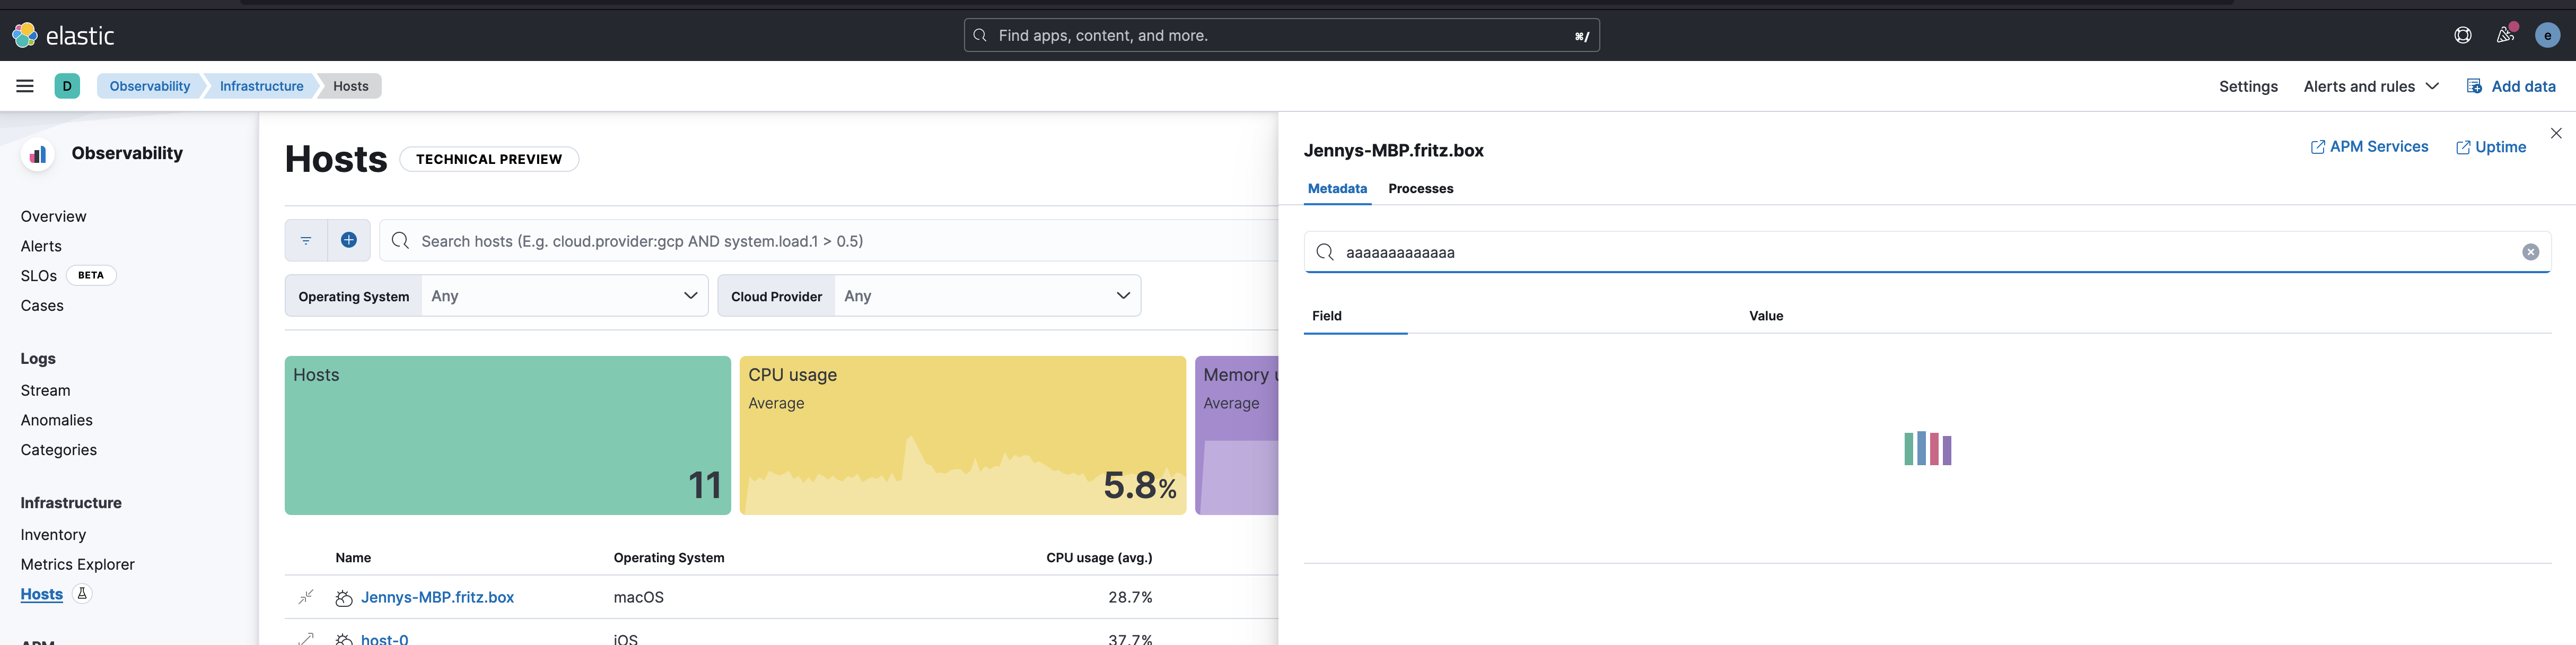
Closes#154347
## Summary
This PR adds search functionality to the metadata tab.
In order to optimize the search I changed the table to
`EuiInMemoryTable` and handled the search there. One benefit is that
table filtering is the responsibility of the table and the cases to
handle errors/no data found are much easier.
<img width="2435" alt="Screenshot 2023-04-06 at 15 36 35"
src="https://user-images.githubusercontent.com/14139027/230400195-b77b7783-9c4d-48b0-85e6-cb38180a29d3.png">
<img width="2434" alt="Screenshot 2023-04-06 at 15 58 22"
src="https://user-images.githubusercontent.com/14139027/230400337-1013626c-c802-4b45-88f1-bff67f0ec37e.png">
This also helped to get rid of some of the callouts condition and leave
the table component to decide what to render based on the items and
loading state. That way the loading looks much smoother rather than
replacing the table with a loading component - also when loading and
there are no results the loading indicator is inside the table.
## Testing
1. Open the flyout for a single host
2. On the metadata tab start searching
a. Try to search for field name/value - should get a result
b. Do a typo with an invalid character (or just enter only ```, `+`,
etc) - an error message should be displayed (and ⚠️ icon in the search
bar)
c. Try to search for something that it's not a field name/value - should
display the `No metadata found.` message in the table.
3. Copy a URL after searching for something and paste it into a new
browser tab/window - it should persist the search term. (In case of a
search error the search filter is not persisted)
https://user-images.githubusercontent.com/14139027/230400149-6ba4dc32-efaa-4068-8abb-24b6ae43de76.mov
## 📓 Summary
Closes#153360
To correctly sync the brush selection with the time service there was
the need for a refactor on how we handle the host filters, simplifying a
bit the code implementation and re-using existing abstractions.
## 🧪 Testing
- Navigate to Hosts View
- Create an Inventory Alert that can easily trigger
- Reload the search until the alerts are triggered
- Click on the alerts tab to preview them
- Select a time range on the chart and see the changes reflected on the
chart and the time range globally applied.
https://user-images.githubusercontent.com/34506779/230015011-1b48deba-7c05-47df-80b1-37e8ee046b05.mov
---------
Co-authored-by: Marco Antonio Ghiani <marcoantonio.ghiani@elastic.co>
Co-authored-by: Kibana Machine <42973632+kibanamachine@users.noreply.github.com>
## Summary
This PR closed#152655 by allowing the following types `['number',
'string', 'ip', 'date']` to be used with the cardinality aggregation. I
also changed the type for `validNormalizedTypes` to a union of the valid
keys instead of just a string, in the name of better Typescript
autocomplete.
---------
Co-authored-by: kibanamachine <42973632+kibanamachine@users.noreply.github.com>
Resolves#153851
## Summary
This PR adds alert time range annotation for the metric threshold rule
details page.

**Note**
I changed the rule criteria to stop the alert, hence the weird graph!
## 🧪 How to test
1. Add `xpack.observability.unsafe.alertDetails.metrics.enabled: true`
to the Kibana config
2. Generate a metric threshold alert
3. Go to the related alert details page and check the annotation
Closes#153202, closes#153850
## Summary
This PR adds alert start annotation and also uses a custom time range
for the alert details' charts depending on the alert duration. The logic
to calculate the time range was added in a separate package to be used
in other use cases as well.

## 🧪 How to test
Create a metric threshold alert and go to the related alert details
page, verify:
- Alert start annotation
- The time range of the charts should be before the alert was started
(1/8 of the duration was added to each side)
---------
Co-authored-by: kibanamachine <42973632+kibanamachine@users.noreply.github.com>
Closes#150907
## Summary
This PR adds the Processes tab to the single host flyout. The component
is already implemented in Inventory so we can reuse it here
## Testing
- Go to hosts view
- Open the flyout for any host to see the single host details
- Click on the processes tab
⚠️ If you want to see the processes summary on top (where the total
processes are displayed) you need inside your metricbeat modules yml
configuration to include the `process_summary` so your config should
include:
```
metricbeat.modules:
- module: system
metricsets:
..... other data .......
- process # Per process metrics
- process_summary # Process summary
..... other data .......
```
<img width="1913" alt="image"
src="https://user-images.githubusercontent.com/14139027/228534978-c38437e4-4279-4ad4-9fc8-5222cbd15c2e.png">
---------
Co-authored-by: Carlos Crespo <crespocarlos@users.noreply.github.com>
Co-authored-by: kibanamachine <42973632+kibanamachine@users.noreply.github.com>
## 📓 Summary
Closes#153741
This PR fixes the time range filter by using the
`kibana.alert.time_range` field instead of `@timestamp`.
## 🧪 Testing
- Navigate to Hosts View
- Create an Inventory Alert that will trigger immediately
- Refresh the search until some alerts are triggered
- Play with relative time range (eg. 15 min ago -> 2 min ago) to verify
alerts appears correctly
---------
Co-authored-by: Marco Antonio Ghiani <marcoantonio.ghiani@elastic.co>
## Summary
This fixes https://github.com/elastic/kibana/issues/154030 (and other
uses of the Log Stream embeddable component).
The embeddable component calls `useLogView()` directly, and this causes
issues with context dependencies for URL syncing from the consumers.
This PR makes the URL actions / services optional within the machine.
Uses:
- `<LogViewProvider />` used for all main Logs pages (stream, anomalies,
categories) has full URL syncing ✅
- `<LogViewProvider />` used within our Logs alert editor does not have
URL syncing (not needed) ❌
- `useLogView()` as used by the embeddable component does not have URL
syncing ❌
- `useLogView()` as used by `RedirectToNodeLogs` does not have URL
syncing (not needed, URL syncing kicks in after redirect) ❌
The default / pure implementation of `initializeFromUrl` just does a
`send({ type: 'INITIALIZED_FROM_URL', logViewReference: null })` as the
state machine needs to transition to it's `initialized` state and is
already set up to use the initial context reference if there's no
reference obtained from the URL.
Examples:


## 📓 Summary
Closes#147691
- Test hosts table content.
- Test to verify the search results hosts to propagate the filter to
other sections.
- Test Logs tab existence, to add a test for logs content once
https://github.com/elastic/kibana/issues/154030 is resolved.
---------
Co-authored-by: Marco Antonio Ghiani <marcoantonio.ghiani@elastic.co>
## Summary

This PR:
- Moves the case bulk actions from the solutions to the alert table
- Refetch when using the case row actions & the case bulk actions.
- Renames the `kibana.alert.case_ids` label to `Cases`
- Unskip the `alerts_table.test.tsx` test file and skip the individual
flaky tests. I run the test file 60 times in the CI without any issues
(9efed89ee9)
- Renames the cases flyout and modal hook from `get*` to `use*`

Fixes: https://github.com/elastic/kibana/issues/151688

## Userflow

## Testing

### Alerts table

- The alerts table does not show the Cases column by default
- You can choose the case column from the fields modal. Type `Case` to
find the cases column
- The label of the column is `Cases`
- The label of the field in the fields modal is `Cases`
- You can bulk attach alerts to a new case
- You can bulk attach alerts to an existing case
- When bulk attaching alerts to a case the alerts table re-fetches the
data
- When attaching an alert to a case from the row actions the alerts
table re-fetches the data

### Case integrations outside the alerts table
- Ensure that you can attach your data to a case (existing and new)

### Checklist

Delete any items that are not applicable to this PR.

- [x] Any text added follows [EUI's writing
guidelines](https://elastic.github.io/eui/#/guidelines/writing), uses
sentence case text and includes [i18n
support](https://github.com/elastic/kibana/blob/main/packages/kbn-i18n/README.md)
- [x] [Unit or functional
tests](https://www.elastic.co/guide/en/kibana/master/development-tests.html)
were updated or added to match the most common scenarios

### For maintainers

- [x] This was checked for breaking API changes and was [labeled
appropriately](https://www.elastic.co/guide/en/kibana/master/contributing.html#kibana-release-notes-process)

---------

Co-authored-by: Kibana Machine <42973632+kibanamachine@users.noreply.github.com>
## Summary
This closes#142840. It is the UI portion of support for inline Log
Views.
## Visible changes to the UI
### ML warning

### Alert dropdown warning

### Settings page warning

## Reviewer hints / notes
- The ACs on the issue are quite extensive and should provide a good
number of things to test.
- Make use of the "playground" page (see below) to make this easier
- The `AlertDropdown` has been made lazy as the page load bundle
increased by 100kb otherwise.
- Our `link-to` functionality is scoped to persisted Log Views only at
the moment as historically they've only accepted a path segment, not
full query parameters. We can look to extend this in the future once we
have concrete linking needs.
## Questions
- I have allowed the Log View client to handle both the inline and
persisted Log Views. I wonder if the function names become confusing?
(e.g. are the RESTful prefixes misleading now?).
- The ML warning splash page links to settings to revert to a persisted
Log View. It could also be done in place on the page. I went back and
forth over whether we should keep the reverting in one place?
## Testing
There is now a "state machine playground" available at the following
URL: `/app/logs/state-machine-playground`, it is enabled in developer
mode only. It's not fancy or pretty it just serves to make testing
things easier. There are various buttons, e.g. `Switch to inline Log
View`, to facilitate easier testing whilst a Log View switcher is not in
the UI itself. You can utilise these buttons, and then head to other
pages to ensure things are working correctly, e.g. warning callouts and
disabled buttons etc. If you'd like to play with the options used, e.g.
for `update`, amend the code within `state_machine_playground.tsx`. It's
also useful just to sit on this page, try various things, and verify
what happens in the developer tools (does the context update correctly
etc).
## Known issues
- When saving on the settings page we actually revert to a "Loading data
sources" state. This is also the case on `main`. The reason for this is
the check within settings looks like so:
```ts
if ((isLoading || isUninitialized) && !resolvedLogView) {
return <SourceLoadingPage />;
}
```
but the `resolvedLogView` state matching looks like so:
```ts
const resolvedLogView = useSelector(logViewStateService, (state) =>
state.matches('checkingStatus') ||
state.matches('resolvedPersistedLogView') ||
state.matches('resolvedInlineLogView')
? state.context.resolvedLogView
: undefined
);
```
so even though we have resolved a Log View previously the state matching
overrides this. I'd prefer to follow this up in a separate issue as I'd
like to think through the ramifications a bit more. It's not a bug, but
it is jarring UX.
---------
Co-authored-by: Kibana Machine <42973632+kibanamachine@users.noreply.github.com>
## 📓 Summary
Closes#153739
Each time the whole inventory table was rerendering due to a click on an
entry, a new list of items was regenerated, reinitializing the in-memory
table component from the first page.
Memoizing the generated items solves the issue and the table work as
expected.
This PR also solve another issue occurring when multiple table entries
were clicked, which resulted in many popovers opened and a blocked UI as
per the following screenshot:
<img width="1267" alt="multi-popover"
src="https://user-images.githubusercontent.com/34506779/228196645-9c0444b7-9114-47c2-8e5d-0bec29ed5305.png">
## 🧪 Testing
- Navigate to `Inventory` and select the `Kubernetes Pods` option from
the **Show** filter.
- Switch the view to a table with the top-right selector
- Verify the popover correctly opens on any entry of the first table
page, then switch to different pages and check the behaviour is
maintained and there are no reinitializations for the table.
- Verify the same from the `Docker Containers` list.
https://user-images.githubusercontent.com/34506779/228198613-afafe3fe-f714-4c88-a288-fc4c95ca801a.mov
Co-authored-by: Marco Antonio Ghiani <marcoantonio.ghiani@elastic.co>
closes  #152831
## Summary

This PR replaces useThrottle with useDebounce in the logs tab to make
sure that we are sending correct requests matching what is typed in the
search field.

### Testing

1. Go to Inventory page
2. Click on any host to open the flyout
3. Go to logs tab and type `message:total` in the search bar
4. Quickly delete the last 2 characters and check the request sent you
will notice it correctly has `message:tot` in the filters