## Summary

- Updates the `get-file` action response `outputs` to match latest from
endpoint
- Fix server size `doesFileHanveChunks()` and remove the `.keyword` from
the search field term (index mapping will be setup correctly for these
indexes)
- Updates the names of the File storage indexes
- Sets the `endpointRbacV1Enabled` FF to `true` (enables feature by
default)
- Uses Fleet exposed function utilities to retrieve the indexes for
File's metadata and data chunks

The following Fleet changes were also done

- Created common methods in fleet for retrieving the file metadata and
data indexes using an integration name (should protect us against index
names going forward and avoid having integrations in kibana keep
hard-coded values)
- Removed the .keyword from a few places in the file server service
(still need to test)
- Adjusted both the Fleet and the Security Solution code to use the new
methods for getting the integration specific index names (cc/
@juliaElastic )
In this PR, I'm adding a new setting
(`xpack.task_manager.monitored_stats_health_verbose_log.level`) that
allows the task manager monitoring stats to be verbosely logged at info
level instead of warning.

The two supported values are:
- debug (default)
- info

This will help debug SDHs on Cloud where we won't want to turn on debug
level on the entire cluster but would still like to see the task manager
monitored stats over time.

## Cloud allow-list PR

https://github.com/elastic/cloud/pull/109563

## To verify
1. Set the following two configuration options:
```
xpack.task_manager.monitored_stats_health_verbose_log.enabled: true
xpack.task_manager.monitored_stats_health_verbose_log.level: info
```
2. Startup Kibana
3. Notice `Latest Monitored Stats:` are logged at info level
4. Remove `xpack.task_manager.monitored_stats_health_verbose_log.level`
configuration
5. Add the following configuration
```
logging:
  loggers:
    - name: plugins.taskManager
      level: debug
```
6. Restart Kibana
7. Notice `Latest Monitored Stats:` are logged at debug level (as usual)

Co-authored-by: Kibana Machine <42973632+kibanamachine@users.noreply.github.com>
## Summary
Issues:
https://github.com/elastic/kibana/issues/131806https://github.com/elastic/kibana/issues/140008
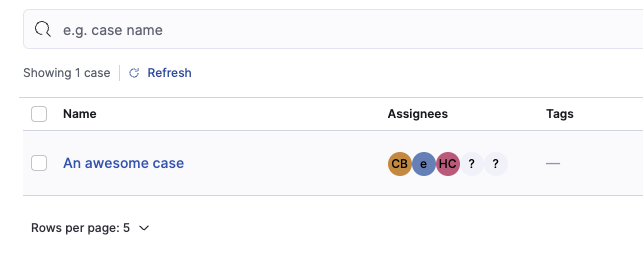
* Increase the default table size of the cases table to 10
* Changed the available page sizes to 10, 25, 50 and 100
* Save the visualization preferences of the cases table in localStorage
* Display the current visualization preferences of the cases table in
the URL
* This logic is not applied if the cases table is opened in a modal
### Screenshots
<img width="1441" alt="Screenshot 2022-10-31 at 12 19 10"
src="https://user-images.githubusercontent.com/1533137/198996468-f33ef67b-4f18-467e-841c-dfcff1574c06.png">
### Checklist
Delete any items that are not applicable to this PR.
- [ ] [Unit or functional
tests](https://www.elastic.co/guide/en/kibana/master/development-tests.html)
were updated or added to match the most common scenarios
- [ ] This was checked for [cross-browser
compatibility](https://www.elastic.co/support/matrix#matrix_browsers)
---
Fixes#140008
## Release notes
* Increase the default table size of the cases table to 10
* Save the visualization preferences of the cases table in localStorage
* Display the current visualization preferences of the cases table in
the URL
Co-authored-by: Kibana Machine <42973632+kibanamachine@users.noreply.github.com>
This PR has a few changes that are needed after learning that the
existing control plane container health check uses `/` as opposed to
`/api/status`:
1. The health gateway server now listens at `/` as opposed to
`/api/status`
2. The health gateway now calls Kibana's `/` not `/api/status`
3. The health gateway will treat a 200-299 or 302 response code OR a 401
response code with a `www-authenticate` response header as healthy

Co-authored-by: Kibana Machine <42973632+kibanamachine@users.noreply.github.com>
## Summary

Clicking on the link for an individual exception list will route users
to the detail view. Currently only displays the list id on the detail
view.

Co-authored-by: kibanamachine <42973632+kibanamachine@users.noreply.github.com>
Implements #143641
## 📝 Summary
Fixes the alerts page crash when a wrong query is entered in the search
bar query string.

**Note**
I am working on tests but I will create a separate PR for that.
## 🧪 How to test
- Go to alerts / rule details page
- Enter an invalid query such as `{`, page should not crash and you
should see a toast with a related error message
Co-authored-by: kibanamachine <42973632+kibanamachine@users.noreply.github.com>
## Summary

Moves the ownership for some of the appservices code to the
visualizations team:

- expressions plugin
- unified search
- data plugin, we decided for now to co-own it with the
@elastic/kibana-data-discovery team
Fixes https://github.com/elastic/kibana/issues/144310

### Summary

This PR addresses the issue of the Kibana instance restarting when the
response size is too big for the `autocomplete_entities` API. This
happens when a cluster has a large number of mappings and we try to
retrieve them all on the server side with
`esClient.asInternalUser.indices.getMapping()`. esClient does not handle
large responses well and throws an error that causes the Kibana instance
to restart. As node's max [string
length](https://developer.mozilla.org/en-US/docs/Web/JavaScript/Reference/Global_Objects/String/length#description)
is 2^28-1 (~512MB) if the response size is over 512MB, it will throw an
error with the message "Invalid string length".

The fix is to use the raw http request to retrieve the mappings instead
of esClient and check the response size before sending it to the client.
If the response size is too big, we will return an empty object and log
the error in the server logs.

#### Proposed changes

- Remove ES JS client requests and use native Node.js HTTP client
instead
- Limit the response size to 10MB for the `autocomplete_entities` API

#### How to test this PR locally
To test this out, you will need to connect Kibana to a remote cluster
with a large number of mappings. We created a patch file that you can
apply to your local Kibana instance to test this PR. Since the patch
file contains credentials, we can't share it publicly. Please reach out
to me if you would like to test this PR. I will share the patch file and
the instructions to apply it.

Co-authored-by: Muhammad Ibragimov <muhammad.ibragimov@elastic.co>
## Summary

The policy editor page still uses this deprecated API, so we need to add
the new `?full` query parameter to its schema as well

Fixes https://github.com/elastic/kibana/issues/144982
## Summary

Closes https://github.com/elastic/kibana/issues/143725,
https://github.com/elastic/kibana/issues/143726

This PR reads the context variables indexed in Alerts-As-Data for
`Infrastructure Rules` and adds it to context when alerts are recovered.

Also, the context variables are now flattened before being indexed in
AAD for both of the `Infrastructure Rules`.

## The context newly added for recovered alerts with this PR
- `cloud.*`
- `host.*`
   - Excluding:
      - `host.cpu.*`
      - `host.disk.*`
      - `host.network.*`
- `orchestrator.*`
- `container.*`
- `labels.*`
- `tags`

### Checklist

- [x] [Unit or functional
tests](https://www.elastic.co/guide/en/kibana/master/development-tests.html)
were updated or added to match the most common scenarios

Co-authored-by: kibanamachine <42973632+kibanamachine@users.noreply.github.com>
## Summary

Closes https://github.com/elastic/kibana/issues/143727

When Inventory rule is created for `Kubernetes Pods` as node type, the
`context.container` will contain an array of containers. For other node
types, the `context.container` will contain single container
information. This is to cover the use case where Kubernetes pod has more
than one container.

## Manual testing

### 1. Create rule for `Kubernetes Pods`
- Create Inventory rule for `Kubernetes Pods`
- Select a connector to schedule action
- Add `{{context}}` in the action template
- Wait for alerts to be generated
- Observe `context.container` lists all containers

<img width="803" alt="Screenshot 2022-11-04 at 10 55 19"
src="https://user-images.githubusercontent.com/69037875/199945124-08590d1e-50ed-4b41-a256-8b16548dbdbd.png">

### 2. Create rule for `Hosts`
- Create Inventory rule for `Hosts`
- Select a connector to schedule action
- Add `{{context}}` in the action template
- Wait for alerts to be generated
- Observe `context.container` contains single container

<img width="520" alt="Screenshot 2022-11-04 at 10 59 31"
src="https://user-images.githubusercontent.com/69037875/199945890-a38a695a-61bc-49cb-9eb4-6fa806f4bdc9.png">

### Checklist
- [x] [Unit or functional
tests](https://www.elastic.co/guide/en/kibana/master/development-tests.html)
were updated or added to match the most common scenarios

Co-authored-by: kibanamachine <42973632+kibanamachine@users.noreply.github.com>