## Summary

- Update URL to point at `/api/product_versions` per @brianjolly's input
- Add basic retry loop per @jbudz suggestion

cc @juliaElastic

---------

Co-authored-by: Kibana Machine <42973632+kibanamachine@users.noreply.github.com>
## Summary

This PR adds onboarding prompts for when vulnerability management
integration is not installed and when vulnerability management is
installed then show scanning empty prompt.

A `<NoVulnerabilitesState/>` component checks for `vuln_mgmt` status. If
the status is `not-deployed` or `indexing` then show
<ScanningVulnerabilitiesEmptyPrompt/>

The packageNoInstalledRender component will listen for the current tab
and renders on `useLocation().pathname`. If `currentTab` is
'vulnerabilities' then we show
`<VulnerabilitiesFindingsInstalledEmptyPrompt/>`. If `currentTab` is
`configurations` then show
`<ConfigurationFindingsInstalledEmptyPrompt/>`


Installed Prompt
<img width="1728" alt="Screen Shot 2023-03-30 at 3 45 35 PM"
src="https://user-images.githubusercontent.com/17135495/229010609-51a8f009-0fe1-45f3-8452-02bdd4234367.png">
Scanning Envioronment
<img width="1724" alt="Screen Shot 2023-03-30 at 3 45 20 PM"
src="https://user-images.githubusercontent.com/17135495/229010649-2d8c8482-c7d2-4040-927d-310354f99a94.png">

---------

Co-authored-by: Kfir Peled <kfir.peled@elastic.co>
## Summary

This PR filters out alerts already attached to a case on the backend.
The schema of the alerts in a case is:

```
{
  alertId: string | string[]
  index: string | string[]
}
```

So the `alertId` can contain multiple alert ids. In this case, if an ID
is attached to the case it will be removed from the `alertId` array. If
all alerts are attach to the case no attachment will be created.

### Checklist

Delete any items that are not applicable to this PR.

- [x] [Unit or functional
tests](https://www.elastic.co/guide/en/kibana/master/development-tests.html)
were updated or added to match the most common scenarios

### For maintainers

- [x] This was checked for breaking API changes and was [labeled
appropriately](https://www.elastic.co/guide/en/kibana/master/contributing.html#kibana-release-notes-process)
## Summary

Get fleet artifacts by `artifact.id` instead of by `artifact.identifier`
before pushing them to the endpoint manifest.

Co-authored-by: Kibana Machine <42973632+kibanamachine@users.noreply.github.com>
### Summary
Disable `Time-series indexing (TSDB)` switch in experimental datastream
settings if TSDB is enabled in the package itself.
As part of this fix, the following changes are included in compliance
with UX rules:
* Rename toggle label from `Time-series indexing (TSDB)` to `Time-series
database (TSDB) indexing`.
* When the toggle is disabled, add a question mark icon with a tooltip
with text `TSDB indexing is enabled by the integration`.
Closes https://github.com/elastic/kibana/issues/152778
### Screenshots
#### Before

#### After
When the integration does NOT enable TSDB:

When the integration DOES enable TSDB:

### Steps to test locally
Refer to the [original
PR](https://github.com/elastic/kibana/pull/144974) for extended context.
#### Testing a package without TSDB
1. Run Kibana on this branch.
2. Add the System integration (version 1.5.2 at the time of writing);
under the `Collect metrics from System instances -> System cpu metrics
-> Advanced options` settings, the `Time-series indexing (TSDB)` switch
should be off and enabled (you should be able to toggle it on and off).
#### Testing a package with TSDB
1. Update the system integration to use TSDB and run a local package
registry:
1. In the integrations repo, bump the patch version of the system
integration: add a changelog entry (1.25.3) and update the version
accordingly in the package manifest.
2. In the manifest of the cpu data stream, add the following to enable
TSDB (see [this
doc](2abe6f635a/docs/developer_tsdb_migration_guidelines.md)
for context):
```
elasticsearch:
index_mode: "time_series"
```
3. Build the system integration: `cd packages/system && elastic-package
build`
4. Run a local package registry: `elastic-package stack up -d -v
--services package-registry`
5. Check at https://localhost:8080/search?package=system that the
version is correct (1.5.3).
4. Run Kibana on this branch to test the change:
1. In your `kibana.dev.yml`, add `xpack.fleet.registryUrl:
https://localhost:8080` if not there already.
2. Also in `kibana.dev.yml`, add `xpack.fleet.enableExperimental:
['experimentalDataStreamSettings']` if not there already.
6. Before running `yarn start`, run `export
NODE_EXTRA_CA_CERTS=$HOME/.elastic-package/profiles/default/certs/kibana/ca-cert.pem`
in the same shell. This is to set up the certificate needed to access
EPR with https.
7. In Kibana, add the System integration (check that the version is
correct); under the `Collect metrics from System instances -> System cpu
metrics -> Advanced options` settings, the `Time-series indexing (TSDB)`
switch should be on and disabled. There should be a question mark icon
with a tooltip.
---------
Co-authored-by: kibanamachine <42973632+kibanamachine@users.noreply.github.com>
Closes#154347
## Summary
This PR adds search functionality to the metadata tab.
In order to optimize the search I changed the table to
`EuiInMemoryTable` and handled the search there. One benefit is that
table filtering is the responsibility of the table and the cases to
handle errors/no data found are much easier.
<img width="2435" alt="Screenshot 2023-04-06 at 15 36 35"
src="https://user-images.githubusercontent.com/14139027/230400195-b77b7783-9c4d-48b0-85e6-cb38180a29d3.png">
<img width="2434" alt="Screenshot 2023-04-06 at 15 58 22"
src="https://user-images.githubusercontent.com/14139027/230400337-1013626c-c802-4b45-88f1-bff67f0ec37e.png">
This also helped to get rid of some of the callouts condition and leave
the table component to decide what to render based on the items and
loading state. That way the loading looks much smoother rather than
replacing the table with a loading component - also when loading and
there are no results the loading indicator is inside the table.
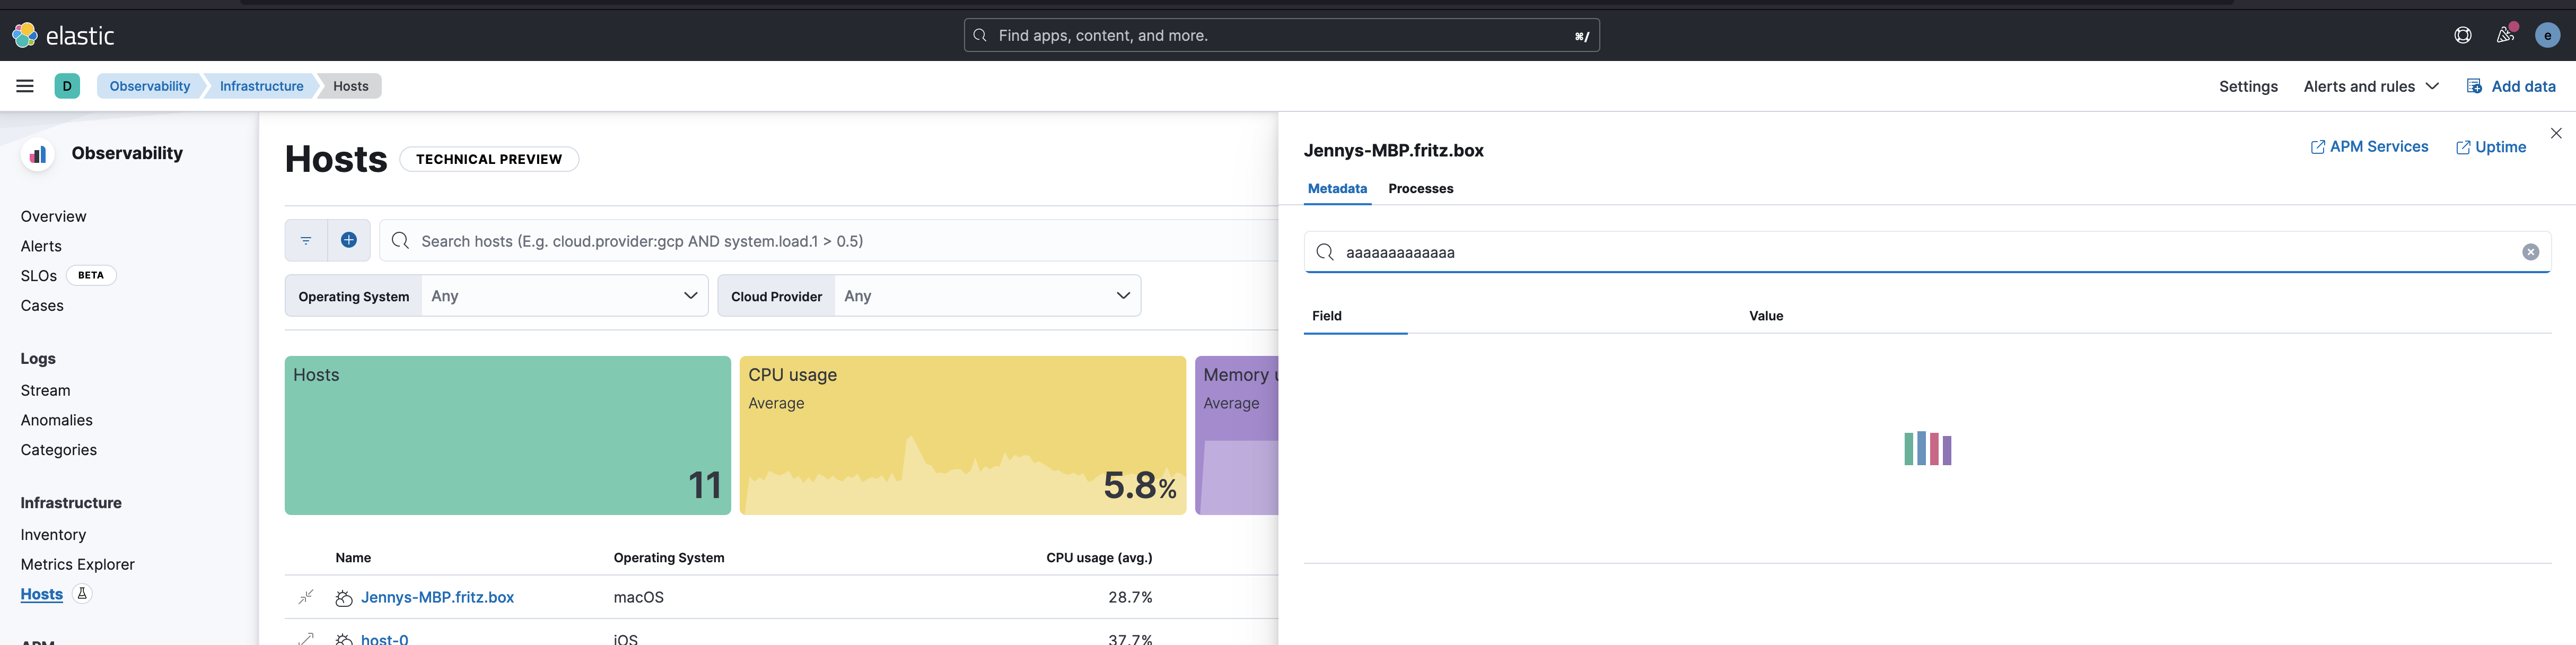
## Testing
1. Open the flyout for a single host
2. On the metadata tab start searching
a. Try to search for field name/value - should get a result
b. Do a typo with an invalid character (or just enter only ```, `+`,
etc) - an error message should be displayed (and ⚠️ icon in the search
bar)
c. Try to search for something that it's not a field name/value - should
display the `No metadata found.` message in the table.
3. Copy a URL after searching for something and paste it into a new
browser tab/window - it should persist the search term. (In case of a
search error the search filter is not persisted)
https://user-images.githubusercontent.com/14139027/230400149-6ba4dc32-efaa-4068-8abb-24b6ae43de76.mov
This PR adds the new configuration settings to the docs. The
configurations were added in this PR:
https://github.com/elastic/kibana/pull/154013

---------

Co-authored-by: lcawl <lcawley@elastic.co>