This PR fixes a failing migration test. The test was likely failing
because we're using es archiver to add saved objects to the kibana index
instead of using the kbn archiver. Since we support importing cases
saved objects I converted most of the places to use the kbn archiver. We
don't export the case configuration type so it cannot be imported so I
had to remove the integration tests and moved them to unit tests
instead.
Fixes: https://github.com/elastic/kibana/issues/139782
Flaky test runner:
https://buildkite.com/elastic/kibana-flaky-test-suite-runner/builds/1855🟢
## Summary

Summarize your PR. If it involves visual changes include a screenshot or
gif.
Merged [PR](https://github.com/elastic/kibana/pull/149716) before seeing
Or's comments. I created a follow-up chore PR to clean and address his
comments.

*  Rename `getResourceFindingsTableFixture` to `getFindingsFixture`
*  Update other `getFindingsFixture`
*  Update unit test description
*  Revert typing to `ResourceFindingsResponseAggs` with an undefined
*  Clean up translation
This PR moves all the optional fields from the get connectors API into a
single optional field. This better communicates that the API will return
all the fields as undefined for they will all be defined.

Example response
```
{
    "4175c370-9cd4-11ed-975e-43fe3caaded6": {
        ...
        "push": {
            "needsToBePushed": false,
            "hasBeenPushed": true,
            "details": {
                "externalService": {
                    ...
                },
                "latestUserActionPushDate": "2023-01-25T17:18:47.819Z",
                "oldestUserActionPushDate": "2023-01-25T17:18:47.819Z"
            }
        }
    }
}
```
Closes#135160
Fixes https://github.com/elastic/kibana/issues/146075
## Summary
Adds the Frequency and Project filter on Management page and all the
filters on Overview page as well.
The PR doesn't show the filters on a dialog as in the design, for the
sake of utilizing existing available component and the fact that opening
a dialog adds one additional step to reach filters. The applied filter
pills/tags (as in the design) are also not implemented as the filter
components show a highlighted number if any filter is applied. Incase
this implementation is not sufficient, the same components can be
converted to match the design easily.
<img width="1482" alt="Screenshot 2023-01-25 at 23 18 30"
src="https://user-images.githubusercontent.com/2748376/214705768-78b431a5-d0fd-4141-82f2-0e9d3af0d8ee.png">
<img width="1484" alt="Screenshot 2023-01-25 at 23 19 12"
src="https://user-images.githubusercontent.com/2748376/214705792-bf62004d-7666-408b-8ca1-4f0f7520a950.png">
---------
Co-authored-by: shahzad31 <shahzad31comp@gmail.com>
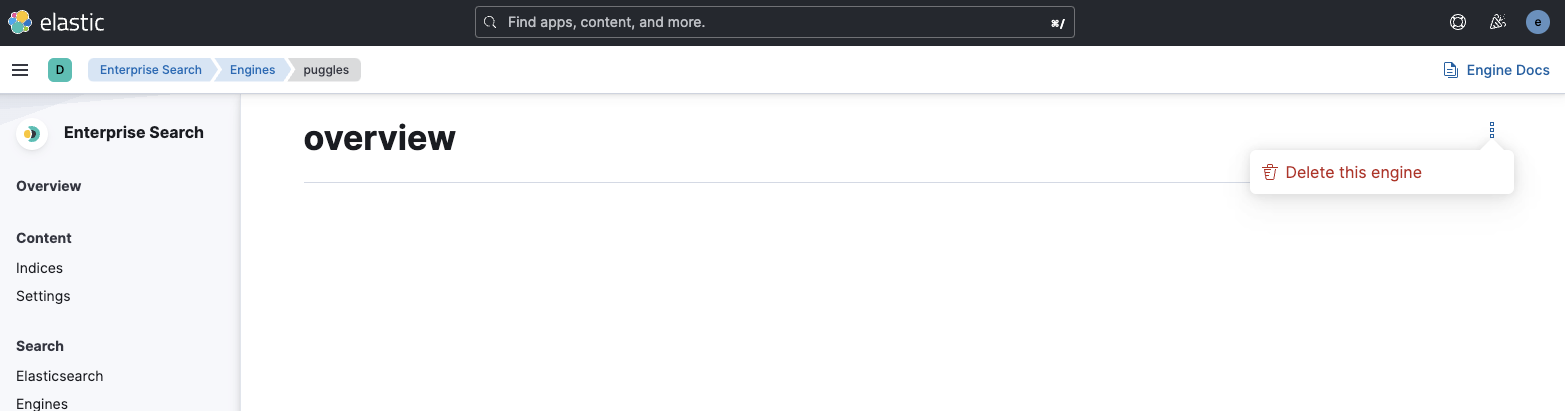
## Summary

Replaced the Engines UI Settings feature flag with product access field
from the client config. Then removed the Engines UI Setting.

We opted for a backend feature flag instead of the UI setting so that a
single feature flag could be used to gate both the UI and the API for
engines for the 8.7 release, since this work will not be completed until
8.8.
## Summary
This PR closes#145444 by adding a custom equation editor to the Metric
Threshold rule. I also added support for custom metrics to the Metric
Explorer API which powers the preview chart on the rule editor.
Eventually we could do a follow up PR to the Metrics Explorer UI to
expose this new functionality; which is outside the scope of this PR.
### Notable changes with this PR
I changed the reason message for Metric Threshold rules which do not
have a group by. The original message would say something like
`system.cpu.user.pct is 82% in the last 1 min for all hosts. Alert when
> 81%.` I removed the `for all hosts` portion because the Metric
Threshold rule is not limited to just the concept of hosts, our users
rely on this rule as their "Swiss Army Knife" rule for all types of
data.
I also had to change the format of the `currentPeriod` bucket for the
Metric Threshold aggregation to support the "document count with KQL
filter" use case. One of the requirements of a `filter` aggregation is
that it must be a child of a multi-bucket aggregation. This is why I
converted it from a 'filter' aggregation to a `filters` aggregation with
an `all` key for the time range query.
I added basic validation for the equations with a regular expression
that just limits the characters to the allowable: `A-Z, +, -, /, *, (,
), ?, !, &, :, |, >, <, =`. I feel like for now this is good enough. If
we want to expose some of the Painless `Math.*` libraries then we can
follow up in a later release with a PegJS parser which would do some
syntax validation as well.
### Rule with custom equation
<img width="538" alt="image"
src="https://user-images.githubusercontent.com/41702/213583128-1adbc405-828e-4571-aeb4-9900baeaabee.png">
### Rule with custom ratio equation
<img width="538" alt="image"
src="https://user-images.githubusercontent.com/41702/213583239-a39d15d2-7023-4daf-af97-cb25a9965433.png">
### Reason message with custom label

---------
Co-authored-by: Carlos Crespo <crespocarlos@users.noreply.github.com>
Co-authored-by: Maryam Saeidi <maryam.saeidi@elastic.co>
## Summary

This PR adds the `ALERT_ACTION_GROUP` to the Alerts-As-Data documents
for both the Metric Threshold and Inventory Threshold rules. It then
uses that value from the alert document in the recovery context to set
`context.originalAlertState`. This also adds
`context.originalStateWasALERT`, `context.originalStateWasWARNING`, and
`context.originalStateWasNO_DATA` (Metric Threshold Only) to allow for
conditional Mustache templates. I also fixed the types for
`getAlertByAlertUuid()` to be more accurate.

#### Metric Threshold Example
```
{{#context.originalAlertStateWasALERT}}
This is a recovery for an ALERT
{{/context.originalAlertStateWasALERT}}

{{#context.originalAlertStateWasWARNING}}
This is a recovery for a WARNING
{{/context.originalAlertStateWasWARNING}}

{{#context.originalAlertStateWasNO_DATA}}
This is a recovery for NO_DATA
{{/context.originalAlertStateWasNO_DATA}}
```

#### Inventory Threshold Example
```
{{#context.originalAlertStateWasALERT}}
This is a recovery for an ALERT
{{/context.originalAlertStateWasALERT}}

{{#context.originalAlertStateWasWARNING}}
This is a recovery for a WARNING
{{/context.originalAlertStateWasWARNING}}
```

Fixes  #145418

### How to test

1. Start Kibana and ingest some data (Metricbeat or whatever)
2. Create a rule (one for each), for the Metric Threshold rule you will
need to group by something like `host.name`
3. Set the conditions to something you can trigger, I used `NO_DATA`
4. Add a server log action for the recovery action group with
`{{context}}`, alternatively you can use the examples above to see the
Mustache logic work
5. Save the rules
6. Stop ingesting data and allow the rule to trigger a `NO DATA` alert
7. Start ingesting data so that it recovers
8. Observe the log message with `originalAlertState` as `NO DATA` for
Metric Threshold and `ALERT` for Inventory Threshold.
Closes https://github.com/elastic/kibana/issues/129383

This PR ensures that fleet callbacks are called regardless if operations
on a package policy are performed via the api or directly using the
package policy service.
Issue #144981

## Summary

This PR fixes the resource findings error pop-up when a query filter
yields no results. Suppose a filter query produces zero results then the
aggregations.key.buckets will return an empty array. In the
`assertNonEmptyArray`, we throw an error if the bucket is not an array
or if the bucket's array.length is 0. We shouldn't throw an error if
there are no results or if buckets is an empty array`[]`. To solve this
issue, we need to remove the `arr.length === 0` condition check from
`assertNonEmptyArray`.

The following changes were also introduced:
- Removed `arr.length === 0` check to show an empty state.
- Added unit tests for Resource Findings Table for cases empty state or
table data
- Added a safety check and provided a default value for the first bucket
key.
-  Update translations for Findings page title

## Screenshot
Success state
<img width="1435" alt="image"
src="https://user-images.githubusercontent.com/17135495/215153634-bbb447db-6d2d-4ce3-b188-e3fc445d16d6.png">


Empty State
<img width="1436" alt="image"
src="https://user-images.githubusercontent.com/17135495/215526796-e02ce0d1-2998-4e2a-b3e8-b67d32893bc2.png">

---------

Co-authored-by: Kibana Machine <42973632+kibanamachine@users.noreply.github.com>
## Summary

`getAgentStatus` will return a status breakdown for the given `kuery`.
The breakdown is returned in the `statusSummary` response key.

This allows us to remove an API call on the agents list page, I also
think this kind of facet is a good thing to have for our API.

We seem to have a mix of camel case and snake case in our API responses,
for this API all the response params are camel case so I kept consistent

- integration test added
- API docs updated


Example request and response:

```
GET  kbn:/api/fleet/agents?getStatusSummary=true&showInactive=true&perPage=0

{
  "list": [],
  "items": [],
  "total": 1001,
  "page": 1,
  "perPage": 0,
  "statusSummary": {
    "online": 1,
    "error": 0,
    "inactive": 500,
    "offline": 0,
    "updating": 0,
    "unenrolled": 500,
    "degraded": 0,
    "enrolling": 0,
    "unenrolling": 0
  }
}
```
## 📓 Summary
Closes#150027
This PR removes from the URL state the `dateRangeTimestamp` filter and
keeps as a unique source of truth the `dateRange`, derivating from this
one the expected timestamp conversion on each update or page refresh.
## 🧪 Testing
1. Go To Hosts view
2. Select `Last 1 hour` time range.
3. Verify the only saved param in the URL is the `dateRange`
4. Wait for a couple of minutes
5. Refresh the page
You should see the data is updated to the last real hour since the
moment the page has been reloaded.
You can more specifically verify this by checking what timestamp range
is sent with the snapshot request payload.
---------
Co-authored-by: Marco Antonio Ghiani <marcoantonio.ghiani@elastic.co>
Co-authored-by: kibanamachine <42973632+kibanamachine@users.noreply.github.com>
## Summary

Trying to address slow config issue:

```
The following "Functional Tests" configs have durations that exceed the maximum amount of time desired for a single CI job. This is not an error, and if you don't own any of these configs then you can ignore this warning.If you own any of these configs please split them up ASAP and ask Operations if you have questions about how to do that.

x-pack/test/alerting_api_integration/spaces_only/config.ts: 41.4 minutes
```

by splitting it into multiple groups.

_1 round (splitting main index file with 3 index suites where each one
has its own setup/tearDown + alerting suite into 4 groups)_

x-pack/test/alerting_api_integration/spaces_only/tests/alerting/group1/config.ts
7m 1s

x-pack/test/alerting_api_integration/spaces_only/tests/alerting/group2/config.ts
**15m 10s**

x-pack/test/alerting_api_integration/spaces_only/tests/alerting/group3/config.ts
**21m 40s**

x-pack/test/alerting_api_integration/spaces_only/tests/alerting/group4/config.ts
5m 30s

x-pack/test/alerting_api_integration/spaces_only/tests/action_task_params/config.ts
2m 31s

x-pack/test/alerting_api_integration/spaces_only/tests/actions/config.ts
4m 22s

_2 round (rebalance groups 1-4 to be more time equal)_

x-pack/test/alerting_api_integration/spaces_only/tests/alerting/group1/config.ts
12m 46s

x-pack/test/alerting_api_integration/spaces_only/tests/alerting/group2/config.ts
8m 46s

x-pack/test/alerting_api_integration/spaces_only/tests/alerting/group3/config.ts
17m 30s

x-pack/test/alerting_api_integration/spaces_only/tests/alerting/group4/config.ts
9m 5s

Here `Alerting eventLog alerts should generate expected alert events for
normal operation` test started to fail, probably there is a dependency
on the previous tests.

_3 round (rebalance groups 1-4, to keep tests order in group 1 up until
`event_log.ts` suite)_

x-pack/test/alerting_api_integration/spaces_only/tests/alerting/group1/config.ts
17m 12s

x-pack/test/alerting_api_integration/spaces_only/tests/alerting/group2/config.ts
8m 28s

x-pack/test/alerting_api_integration/spaces_only/tests/alerting/group3/config.ts
16m 15s

x-pack/test/alerting_api_integration/spaces_only/tests/alerting/group4/config.ts
6m 21s

_4 round (rebalancing groups 3-4 to be more time equal)_

x-pack/test/alerting_api_integration/spaces_only/tests/alerting/group1/config.ts
**17m 14s**

x-pack/test/alerting_api_integration/spaces_only/tests/alerting/group2/config.ts
**8m 37s**

x-pack/test/alerting_api_integration/spaces_only/tests/alerting/group3/config.ts
**12m 40s**

x-pack/test/alerting_api_integration/spaces_only/tests/alerting/group4/config.ts
**9m 49s**

---------

Co-authored-by: kibanamachine <42973632+kibanamachine@users.noreply.github.com>